15
$\begingroup$

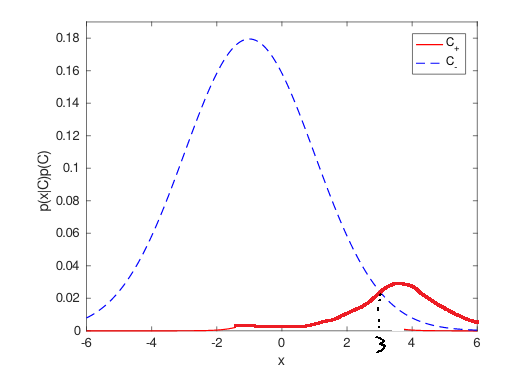
In cases where there is a substantial difference in relative class frequencies, it could be that the density of the minority class is never higher than the density of the majority class anywhere in the attribute space. Here is a simple example using univariate Gaussian classes, with an imbalance ratio of 1:9.

enter image description here

In this case, if my classifier assigns all patterns to the majority class, it is doing exactly the right thing, and there is no problem to solve.

In this case, we know the true data generating process, so we know that the classifier is doing the right thing. However in general we don't know the true distributions of positive and negative classes, so we don't know whether the classifier is doing the right thing or not.

So my question is: In practical applications, how do we decide if we have a class imbalance problem, or whether the classifier is just giving the correct answer, to the question as posed?

Full disclosure: My intuition is that in most cases, especially when the data is not unduly scarce, the classifier is doing exactly what it should do and there is no class imbalance problem. I am primarily interested to hear how other practitioners and researchers diagnose class imbalance problems.

$\endgroup$
20
  • 4
    $\begingroup$ I recently went down a really interesting rabbit hole in this area. I recommend this question and this (somewhat un-related) answer. $\endgroup$
    – TravisJ
    Commented Aug 9, 2021 at 14:15
  • 1
    $\begingroup$ I do not see the problem, and you even admit that the model is doing exactly what it is supposed to do. Perhaps you could clarify what you see as the problem. (Do you just mean checking if the class imbalance is because our data are biased?) $\endgroup$
    – Dave
    Commented Aug 9, 2021 at 14:31
  • 1
    $\begingroup$ @Dave In this instance it is doing the right thing, but it is not that difficult to construct cases where there is a non-trivial decision boundary and the classifier is biased against the positive class. I am asking how practitioners decide which is which in their application (or indeed if they do decide). A lot of the answers relating to class imbalance here are rather, err, imbalanced, one way or the other, and it is rather more of a nuanced issue than seems to be appreciated. $\endgroup$ Commented Aug 9, 2021 at 15:39
  • 2
    $\begingroup$ Could you give an example of what you mean by the decision boundary being non-trivial and the classifier (probability model...) being biased against the positive class? I do not follow. $\endgroup$
    – Dave
    Commented Aug 9, 2021 at 15:45
  • 1
    $\begingroup$ You do that knowing the true populations. When we do not know the true populations, we have to rely on signal-to-noise ratio. Until that becomes very strong, what business do we have in going strongly against the prior probability that favors blue? If we have excellent estimates of both the red and blue distributions, we will be able to get red to peak through and be identified as more likely to be red. $\endgroup$
    – Dave
    Commented Aug 10, 2021 at 13:49

3 Answers 3

4
$\begingroup$

Well, I think the lack of an answer that explains how to detect whether class imbalance is a problem in a particular application, even when a modest bounty of +50 reputation was on offer, suggests cause for concern about research on the topic of class imbalance. I suspect practitioners are frequently re-balancing or re-weighting the datasets simply because they are imbalanced, rather than because the imbalance is actually causing a problem. I further suspect that often this is just making matters worse by over-compensating (e.g. by fully balancing the dataset).

Class imbalance can cause a problem when there are two few examples of the minority class to adequately characterise it's statistical distribution. When this happens, the decision boundary does tend to be unduly biased in favour of the majority class. However, as you add more data, the problem goes away. This shouldn't be a surprise. If you have a large enough neural network, it will be a universal approximator, able to implement essentially any (one-to-one or many-to-one) mapping between the input and output spaces. If it is fitted using a proper scoring rule then asymptotically it will output the true posterior probabilities of class membership. So if you have enough data, it doesn't matter how imbalanced the problem is, a complex enough model will learn the optimal decision surface.

I think any means of detecting and dealing with class imbalance problems will be very tricky though. Essentially if there is a bias, you will want to re-sample or re-weight the training sample just the right amount to compensate for the bias due to the "imbalance". Exactly balancing the dataset is likely to way over-compensate and make accuracy (or expected loss) worse rather than better. The trouble is, if you don't have enough data to describe the minority class, where are you going to get the data to choose the optimal degree of bias? I suspect the best approach will be some Bayesian scheme that determines what the plausible true positive rate (for example) could be if the model were correct.

Essentially, I know from experience that class imbalance can cause estimation problems, in a small data setting, but I'm not convinced that there is a great deal we can do about it because we don't have enough independent data to tune the compensation applied. I think we should be very wary of up/down sampling or reweighting simply because there is an imbalance, and if we do, we need to be able to determine whether it has worked or not. This requires at least that we know what criterion is important for our application, and why it is important. No application is primarily interested in the true positive rate, if that were true, we would just assign everything to the positive class and go home satisfied with having done the optimal job! ;o)

$\endgroup$
5
  • 2
    $\begingroup$ This could be an interesting reading: Wallace, Dahabreh (2012) Class Probability Estimates are Unreliable for Imbalanced Data (and How to Fix Them) $\endgroup$
    – lcorag
    Commented Aug 19, 2021 at 18:14
  • $\begingroup$ Thanks @luco00, I'll give it a read. It seems a common misapprehension that only discrete classifiers like the SVM have problems with class imbalance, it isn't true, probabilistic classifiers have the same problems. $\endgroup$ Commented Aug 19, 2021 at 18:21
  • $\begingroup$ Ah, I think that is one I've seen before - I tried bagging down-sampled models, which was one of their recipies IIRC, but it made the results much worse. Again the problem is working out how much to compensate. $\endgroup$ Commented Aug 19, 2021 at 18:25
  • 1
    $\begingroup$ I think you should have a careful read of gking.harvard.edu/files/0s.pdf (as at least to me it's confusing). Yes, logistic regression MLE for small samples is biased (so not calibrated) . However the variance of small samples is much larger than the bias, so their actual recommendation (minimising MSE) is to use a biased estimator see fig 6 and 7, not removing the bias. reweighting/up down sampling are required for computational reasons not for reducing bias. My take is that methods of variance reduction (such as crossvalidated regularisation) are perhaps all that is required. $\endgroup$
    – seanv507
    Commented Aug 30, 2021 at 17:23
  • $\begingroup$ @seanv507 cheers, I've been reading that paper and some of the references today. In the experiments I have done, regularisation isn't sufficient to correct for the bias against the positive class. I've used differential sampling and weighting in the past, but only for situations where operational class frequencies are different from those in the training set. I'm not sure class imbalance problems can be fixed that way because there is no way to determine how much to up-sample or down-sample without over-compensating. It could be that it is just not something that can be reliably fixed. $\endgroup$ Commented Aug 30, 2021 at 17:34
4
$\begingroup$

I'm going to have a go at explaining why I think detecting a class imbalance problem is likely to be difficult because of the paucity of data when we actually do have a problem.

Consider a univariate normal pattern recognition task, with a 19:1 ratio of negative to positive examples (so that classifying everything as negative gives an accuracy of 95%), but where a decision boundary could be drawn giving an accuracy better than 95%. The ideal distributions and decision boundary are shown below:
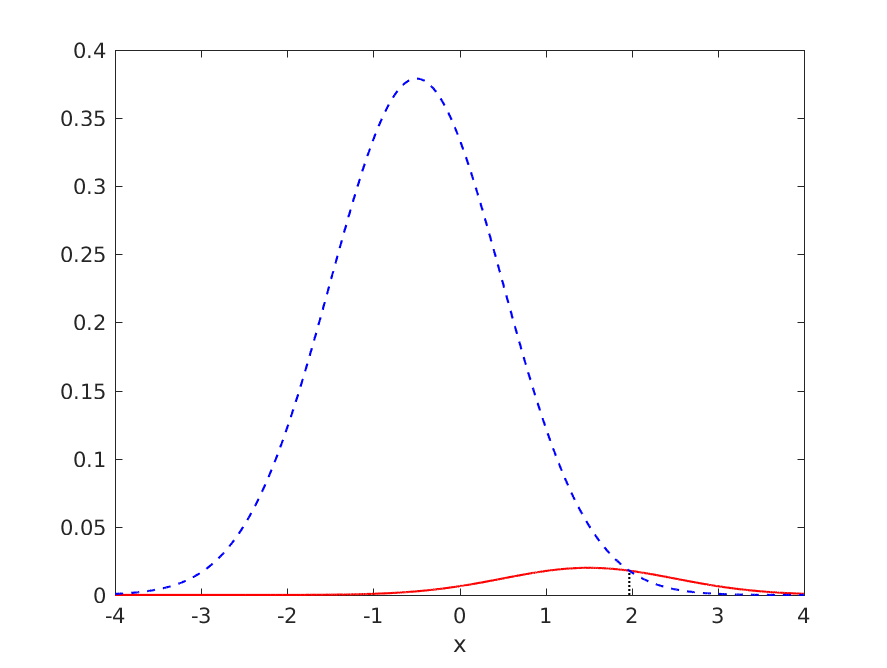
enter image description here

The generalisation performance of the ideal classifier is as follows:

  • TPR = 0.318385
  • FNR = 0.681615
  • TNR = 0.993286
  • FPR = 0.006714
  • ERR = 0.040459
  • ACC = 0.959541

where TPR is the true positive rate, FNR is the false negative rate, TNR is the true negative rate, FPR is the false positive rate, ERR is the error rate and ACC = 1 - ERR is the accuracy.

Assume the variances of both classes are know, so we only need to estimate the class means. Unfortunately, if we have to estimate the means from only a small sample of data, we might be unlucky and end up with a model where the decision boundary is so far from areas of high data density that we may as well classify everything as belonging to the majority negative class. This is an example of the class imbalance problem, because the uncertainty in estimating the parameters leads to a bias against the minority positive class. Here we have a model with 152 negative patterns and 8 positive patterns:
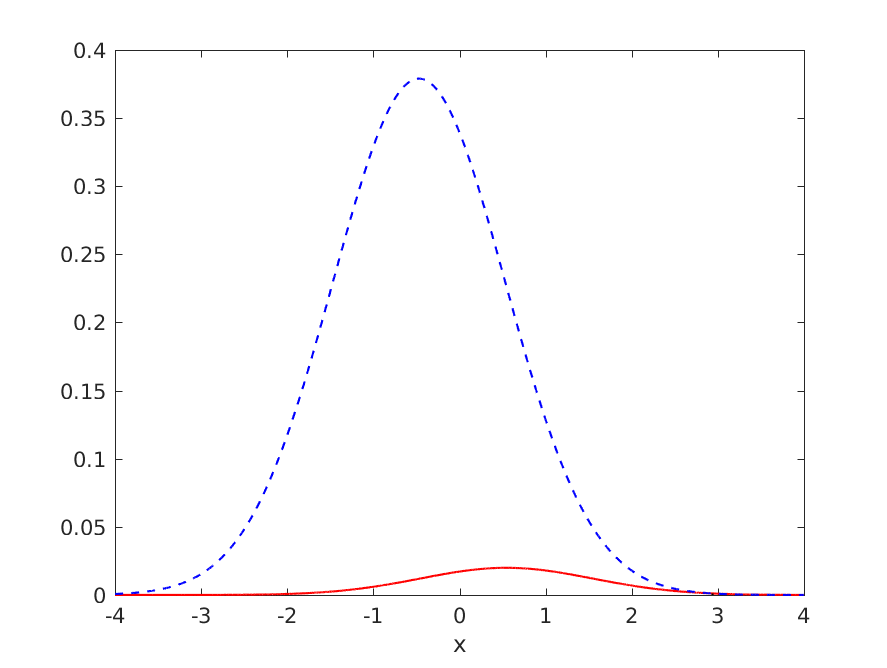
enter image description here

I didn't have to work to hard to be unlucky, this is only the 21st seed of the random number generator I tried. The training set statistics are:

  • TPR = 0.00
  • FNR = 1.00
  • TNR = 1.00
  • FPR = 0.00
  • ERR = 0.05
  • ACC = 0.95

Clearly this is not very good, it is no better than classifying everything as negative.

So lets see if we can detect this problem by having a validation set, again with 152 negative examples and 8 positive examples, in the same ratio as the training set:

  • TPR = 0.00
  • FNR = 1.00
  • TNR = 1.00
  • FPR = 0.00
  • ERR = 0.05
  • ACC = 0.95

Oh dear, the validations set suggests this is a case where no meaningful classification is possible. However, we know that is not true in this case, by construction. The problem is that, like the training set, it is only a small sample of data, and we have just been unlucky again. If we were to sample some more validation data, we might get a different result. However, if we could collect more data, we would use it for training the model and we would get better parameter estimates and the class imbalance problem would likely go away.

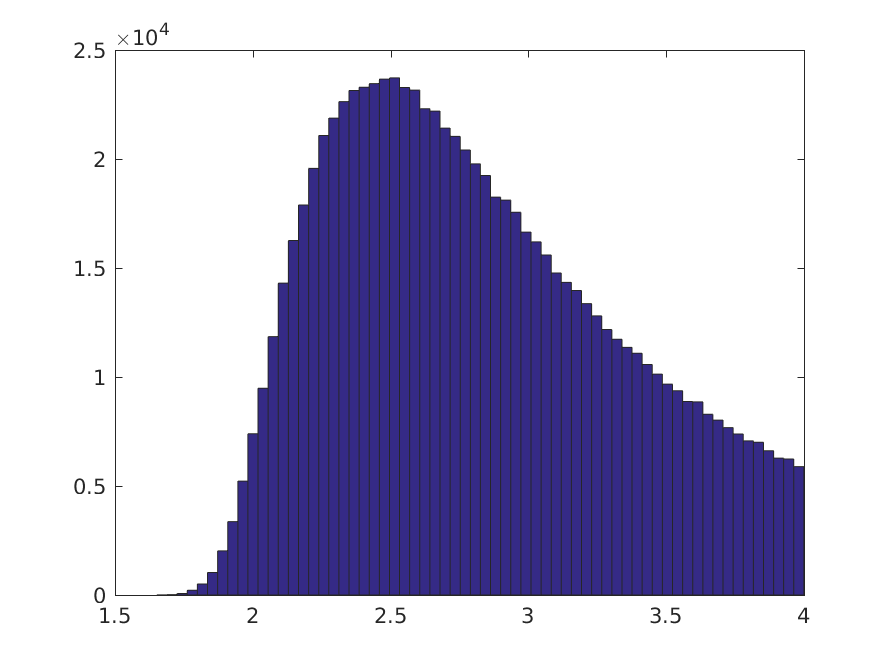
So my initial thought was to see if we could make a Bayesian test of whether it was plausible that there may be a non-trivial decision to be made, given the training data we actually have. If we choose an improper flat prior,our posterior distribution for the class means are Gaussian distributions, centered on the sample means, with standard deviations given by the standard errors of the means (in agreement with the frequentist confidence intervals). We can then perform a Monte Carlo simulation, of say 2^20 samples (as they can be collected so cheaply in this case and I like round numbers), and estimate the posterior distribution for the decision boundary.
enter image description here

About 79% of the 2^20 samples gives a threshold that is in an area of high data density, the remaining 21% are so far to the right of both classes that essentially all patterns will be classified as negative. We can also look at the posterior distribution for the true positive rate:
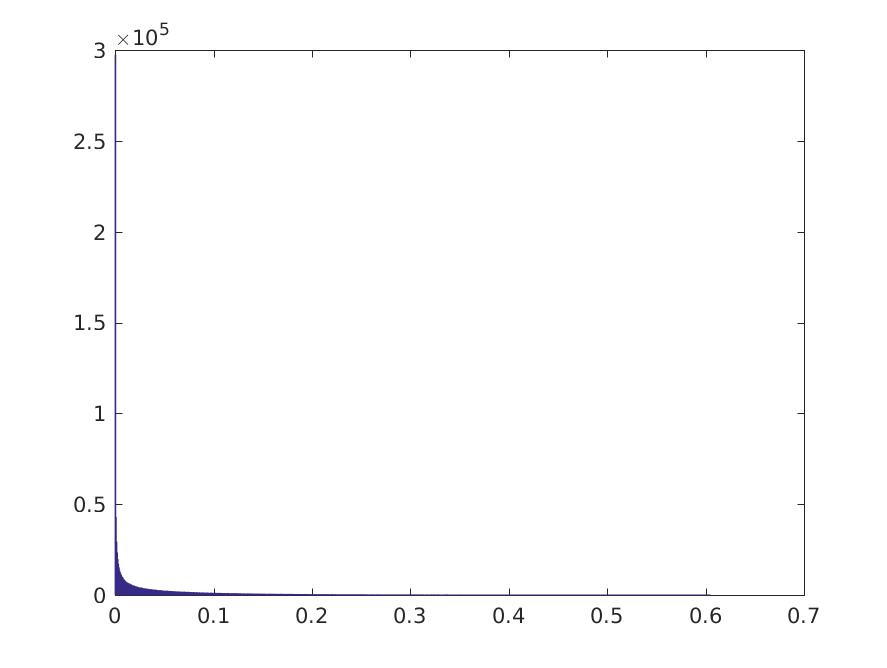
enter image description here

This suggests that there is some chance of a meaningful classification. Let's make an arbitrary threshold at which we might consider a true positive rate as "meaningful" at 0.05. The proportion of Monte Carlo samples, for which the TPR >= 0.05 is about 22.7%, so in this case, we might diagnose the plausibility of a class imbalance problem.

However, what happens if we try it again, but this time for a problem where classifying everything as negative is more or less optimal:
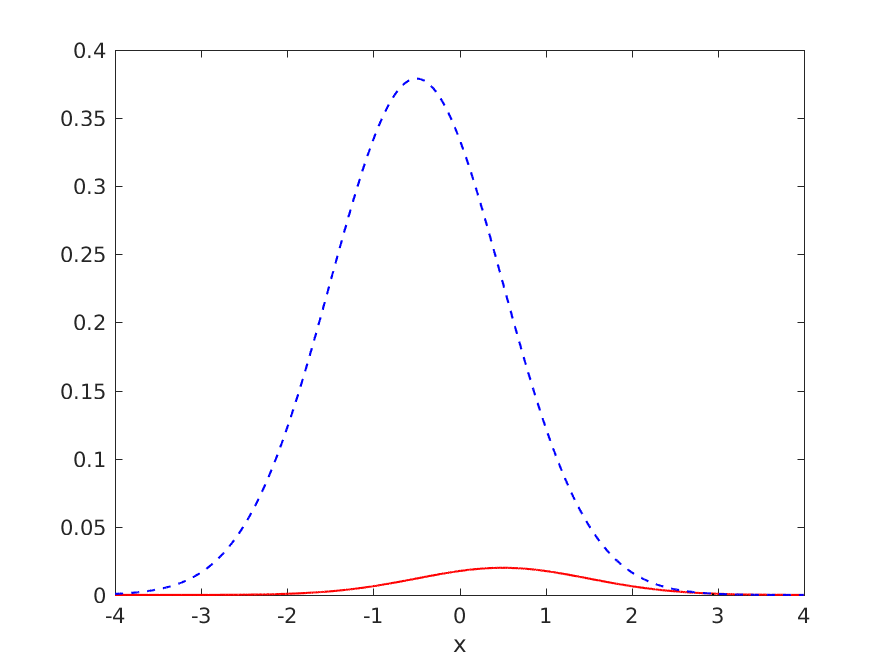
enter image description here

where the optimal model's generalisation performance is summarised by:

  • TPR = 0.007254
  • FNR = 0.992746
  • TNR = 0.999714
  • FPR = 0.000286
  • ERR = 0.049909
  • ACC = 0.950091

Again we have to estimate the class means from a small dataset with 152 negative examples and 8 positive examples, and again we are unlucky,
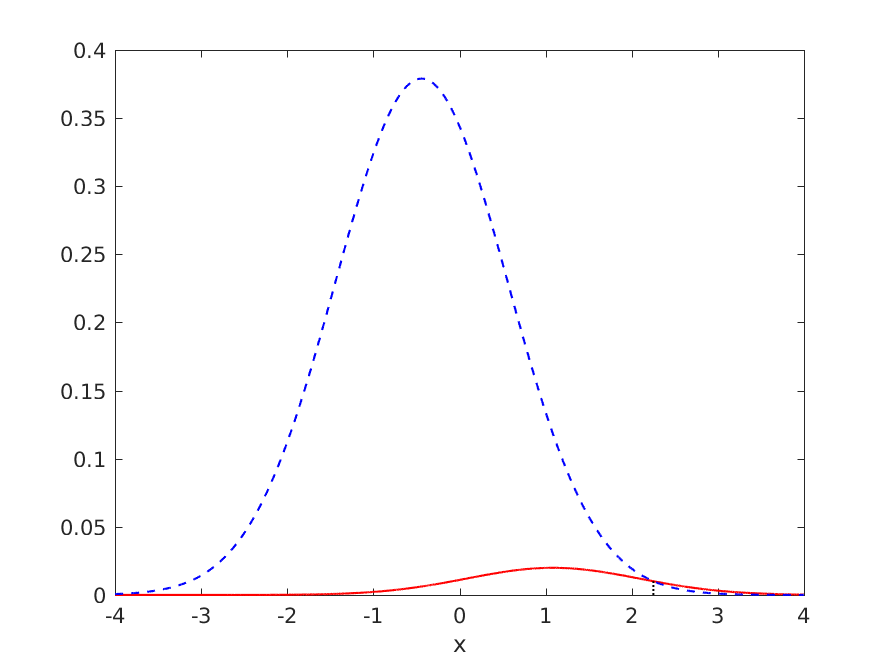
enter image description here

The training set performance is given by:

  • TPR = 0.25
  • FNR = 0.75
  • TNR = 1.00
  • FPR = 0.00
  • ERR = 0.0375
  • ACC = 0.9625

and the validation set performance by

  • TPR = 0.125
  • FNR = 0.875
  • TNR = 1.000
  • FPR = 0.000
  • ERR = 0.04375
  • ACC = 0.95625

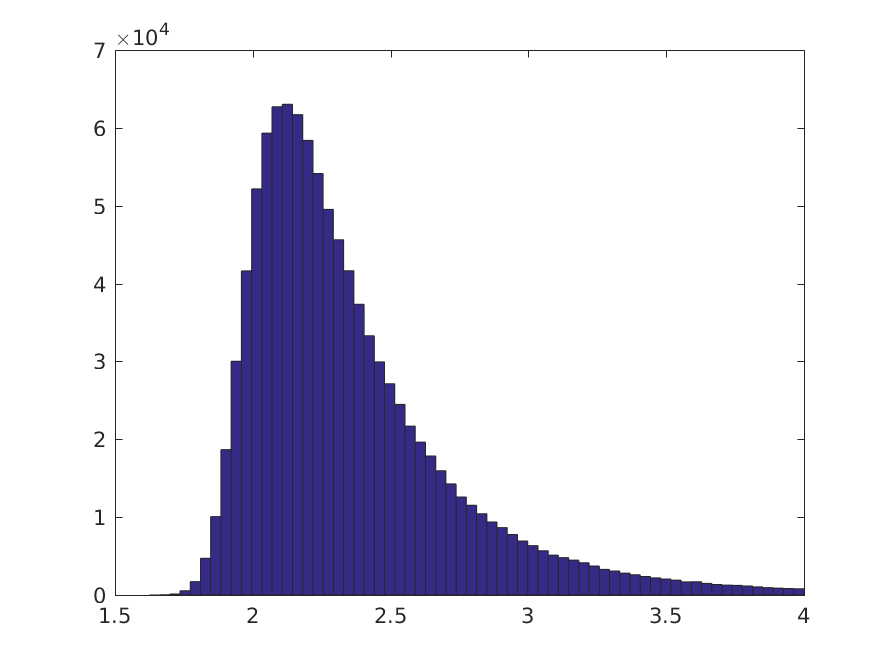
In this case, the Monte Carlo simulation is very confident that a meaningful classification is plausible
enter image description here

The proportion of Monte Carlo samples giving a TPR >= 0.05 is about 74.5%, when of course we know by construction that the optimal model assigns all patterns to the negative class.

This suggests the Bayesian analysis can suggest that a meaningful classification is plausible, even though we have a classifier that ostensibly classifies all patterns to the negative class. In that situation, we may want to think of doing something to alleviate the problem. However, such a test can't tell us when we should be classifying everything as negative.

Anyway, that was the sort of answer I was hoping for, but I'd much prefer something that actually worked in practice! ;o) I may well offer a second bounty if someone can provide something substantially better than this.

$\endgroup$
3
$\begingroup$

I challenge that there is a problem. Let's go with the scenario you described in the comments where your red graph is shifted to the right a bit.

enter image description here

I will make up some (plausible) numbers and go through Bayes' theorem.

$$ P(\text{red}) = 0.2$$$$P(\text{blue}) = 0.8 $$

$$ P(X>3\vert \text{red}) = 0.6$$$$P(X>3\vert \text{blue}) = 0.05 $$

Now Bayes' theorem:

$$ P(\text{red}\vert X>3) = \dfrac{P(X>3\vert\text{red})P(\text{red})}{P(X>3)} $$

$$P(X>3) = P(X>3\cap\text{red}) + P(X>3\cap\text{red}^C) $$$$= P(X>3\cap\text{red}) + P(X>3\cap\text{blue})$$ $$ = P(X>3\vert \text{red})P(\text{red}) + P(X>3\vert \text{blue})P(\text{blue}) $$$$=(0.6)(0.2) + (0.05)(0.8) = 0.16$$

Now let's put it all together in Bayes' theorem.

$$ P(\text{red}\vert X>3) = \dfrac{(0.6)(0.2)}{(0.16)} = 0.75 $$

That's a much larger probability of being red than the prior probability of $0.2$.

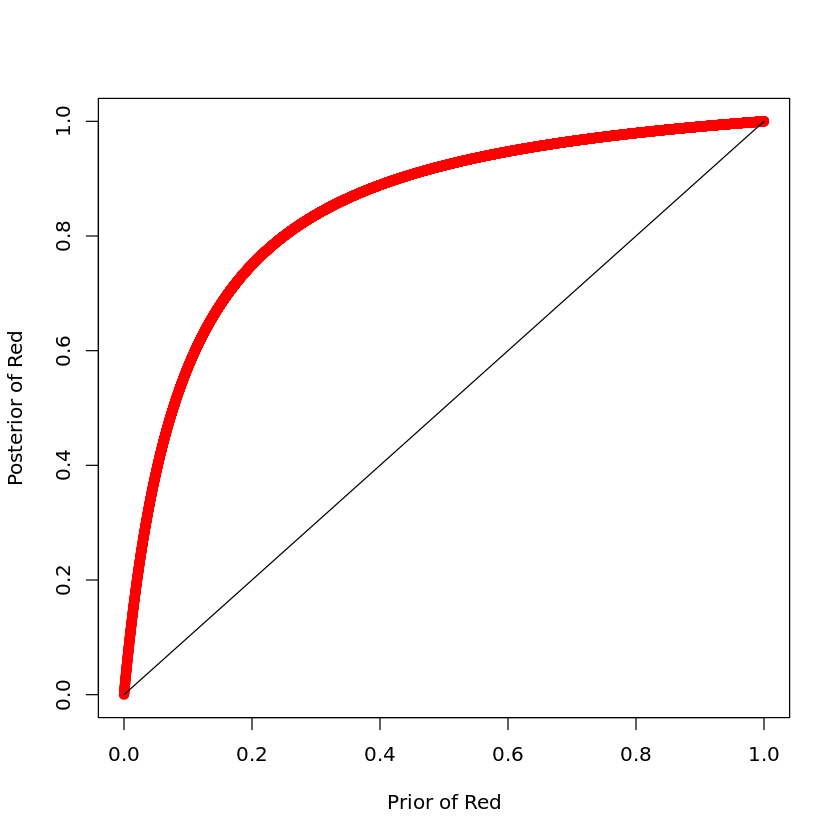
Varying the prior probability of being red reveals a similar story of consistently having a higher posterior probability of being red than prior probability of being red.

posterior <- function(x, y, z){
    return(x*y/(x*y + z*(1-x)))
}
prior <- seq(0, 1, 0.0001)
plot(prior, posterior(prior, 0.6, 0.05), xlab = "Prior of Red", ylab = "Posterior of Red", col = 'red')
lines(prior, prior)

The class imbalance does not overwhelm the posterior probability, and I have tried this with even smaller shifts of red to the right. A tiny shift results in a plot that is very close to the diagonal, but it still bends up a little bit.

enter image description here

$\endgroup$
16
  • 2
    $\begingroup$ This does not address the question. In practice we do not know the true distributions. The class imbalance problem is an estimation problem - we don't know the true parameters of the distribution and have to estimate them from the data. If the error in those estimates cause a bias in the decision threshold that goes against the minority class, we have an example of the class imbalance problem. That cannot be demonstrated by an example where the true parameters are known. I want to know how people diagnose a class imbalance problem in operational use. $\endgroup$ Commented Aug 11, 2021 at 6:52
  • $\begingroup$ The point of my diagram was to show that we can't use all patterns being assigned to the majority class as an indication of a class imbalance problem because sometimes that is the optimal solution. So how do we rule out that possibility? How do we decide to use resampling or re-weighting? I suspect in a lot of cases these techniques are used simply because people are following a roadmap/recipe and are making their classifier worse by "correcting" an already optimal classifier. However, it may be that there is a diagnostic method I don't know about. $\endgroup$ Commented Aug 11, 2021 at 7:02
  • 1
    $\begingroup$ That is not obvious, and playing around with rms::calibrate shows that the class imbalance can be quite a bit ($600:1$) without bad miscalibration. set.seed(2021); N <- 200000; x1 <- rnorm(N); x2 <- rnorm(N); z <- -12 + 2*x1 + 3*x2; pr <- 1/(1+exp(-z)); y <- rbinom(N,1,pr); L <- rms::lrm(y ~ x1 + x2, x = T, y = T); cal <- rms::calibrate(L); plot(cal) $\endgroup$
    – Dave
    Commented Aug 13, 2021 at 16:23
  • 1
    $\begingroup$ Class imbalance is a problem when you don't have enough data to properly characterize the minority class. The imbalance itself isn't the problem, it is that imbalanced problems tend to be the ones with too little data for one of the classes. You are not going to see a class imbalance problem with that many examples. (BTW I don't speak R, so I am not completely sure I understand the code). Most estimation problems are solved by adding lots of data. $\endgroup$ Commented Aug 13, 2021 at 16:26
  • 3
    $\begingroup$ It fits a logistic regression to $200000$ points that have a class imbalance of over $600:1$, then plots the calibration curves the way Harrell does it. // This is the first time that I am understanding your question, which seems to be about lacking much data on the minority class rather than there being a class imbalance. That is not clear in your original post, and I think clarifying that point might result in more satisfactory answers to your (interesting!) question. $\endgroup$
    – Dave
    Commented Aug 13, 2021 at 16:31

Your Answer

By clicking “Post Your Answer”, you agree to our terms of service and acknowledge you have read our privacy policy.

Not the answer you're looking for? Browse other questions tagged or ask your own question.