5

I am curious if and where the following reasoning breaks down.

Traditionally, sample size determination is done as part of the design phase. To this end, one has to have an understanding of the baseline performance, such as the mean and standard deviation of the metric in question. One might use recent historical data to obtain reasonable estimates.

Suppose we are not necessarily interested in knowing the minimal sample size ahead of time and simply launch the experiment. The control group is the baseline. Each day, we take the statistics of the control group and perform sample size determination. With each new day passed, we get a better and better understanding of when to stop.

Apart from the fact that one might launch an experiment that is doomed to fail, are there any other problems with the above logic?

Clarification 1: It should be noted that this question is not about whether it is sound to check some p-value on a daily basis and stop whenever it goes below a predefined level. The inadequacy of this procedure is well understood.

Clarification 2: Here we are not assuming any clinical or otherwise setting with serious implications and ethical concerns. Rather, one can imagine something trivial, such as an experiment with a webpage where the color of a button is subject to change.

Clarification 3: The question describes a specific stopping rule: every day, run a power analysis using the statistics of the data for the control group collected up to today and terminate the experiment as soon as the actual sample size exceeds the one given by the power analysis, potentially skipping a few first days to avoid pathological cases.

7
  • 1
    A major difficulty with doing such an undesigned sequential test, rejecting when the P-value first happens to stumble below 5%, is the risk of false discovery.
    – BruceET
    Commented Aug 18, 2021 at 18:36
  • 1
    You can do optional stopping but need to adjust the p-value after each observation. See daniellakens.blogspot.com/2020/09/…
    – CatM
    Commented Aug 18, 2021 at 23:00
  • 1
    @BruceET, I didn’t mention any p-values. The question is not about whether it is sound to check p-values daily and stop whenever it goes below a predefined level. The inadequacy of this is well understood. Or am I missing some connection? Thank you!
    – Ivan
    Commented Aug 19, 2021 at 8:24
  • Your modification leaves doubt what kind of sequential tampering with a non-sequential protocol you think might be OK. The only correct answer to that is None. I stand by my original Answer.
    – BruceET
    Commented Aug 19, 2021 at 17:23
  • The question needs to define the need for the approach. What you are describing is doing an exploratory analysis and trying to retrospectively use it as confirmatory analysis. To me you would be better accepting that it is exploratory and using the data to establish baseline behaviour to design confirmatory analysis. If you are using it in a low impact and risk scenario then acknowledging the uncertainty of unconfirmed exploratory analysis may allow some immediate response proportional to the risk. If the application is high impact and risk then more care is needed.
    – ReneBt
    Commented Aug 23, 2021 at 4:26

5 Answers 5

4
+25

A priori sample size calculations are only sensible if there is a fixed cost to sampling

This is an excellent question, and it raises some common-sense issues that are commonly misunderstood in sampling theory. When we are considering sample size questions, the first thing we need to ask ourselves is what (if any) impediment, inconvenience, cost, etc., there is to just collecting all the data there is on the matter of interest. If there is no cost to this (construed broadly as including time, money, etc.) then we might as well go out and collect all possible data on the matter and then we don't need statistical inference procedures at all. Consequently, the idea of using a limited sample size that is less than what is possible only arises as a sensible procedure when there is some cost to sampling.

Once we have identified the costs of sampling (again, construed broadly to include more than just money), we need to decide if there are any fixed costs that accrue when we conduct a sampling "excursion", or not. If there are no fixed costs then there is no need to limit our data collection by any a priori calculation --- we can just collect some data, decide if it is enough, collect some more, decide if it is enough, and so on. So in this case, we can indeed do something like what you describe; sampling without any a prioiri sample size calculation and then stopping when we have enough data for the inferences we want to make. (We need to be a bit careful with this method, because certain kinds of "stopping rules" combined with particular statistical procedures can bias analysis, but assuming we are cognisant of this, we should be able to formulate an appropriate "stopping rule" and stop when we have the data we need.) Various statistical control processes operate in exactly this way --- they collect data as it is generated and update inferences with each new data point.

If there are fixed costs to sampling, but the fixed costs are quite low relative to the unit costs, it might still be useful to sample over more than one "excursion". In such a case we might make an initial a priori sample size calculation for an initial "pilot" set of data, then use this data to make an updated sample size calculation for the next set of data, and so on. In this case there might be a number of data collection excursions, but each will involve a sample size calculation. This is also somewhat similar to what you describe. Finally, if the fixed costs of sampling are quite substantial relative to the unit costs, then the "traditional" method of using only one sampling "excursion" is probably going to be optimal. In this case the sample size is fully determined by a single a priori calculation.

So, in terms of where your reasoning breaks down, it is only in the possibly exaggerated claim that "[t]raditionally, sample size determination is done as part of the design phase." This is only true if there are substantial fixed costs to sampling that make it desirable to sample "in one go" and thereby necessitate an a priori computation of the entire sample size. Your observation that it can be sensible to collect data "as you go" is perfectly legitimate (under appropriate circumstances), and it is actually an underappreciated principle of sampling theory.

1
  • Thank you! After your response, I understand better what my own question is actually asking. Please see Clarification 3. Then the essence is in whether this stopping rule possesses the characteristics what would make it sound. When you said one has to be mindful about the method used, you were probably thinking about something like what Kruschke describes in “Bayesian estimation supersedes the t test,” which gives another stopping rule.
    – Ivan
    Commented Aug 27, 2021 at 7:29
0

Example: Suppose you have n=67 observations from a normal population with unknown population mean μ and standard deviation σ. You wish to test H0:μ=106 against Ha:μ106. and you want the power of a one sample t test at the 5% level to be about 90% when the true mean is μ=100.

Then a simple simulation in R shows that n=67 observations is sufficient to give the desired power:

set.seed(2021)
pv = replicate(10^6, t.test(rnorm(67, 100, 15), mu = 106)$p.val)
mean(pv <= 0.05)
[1] 0.896917

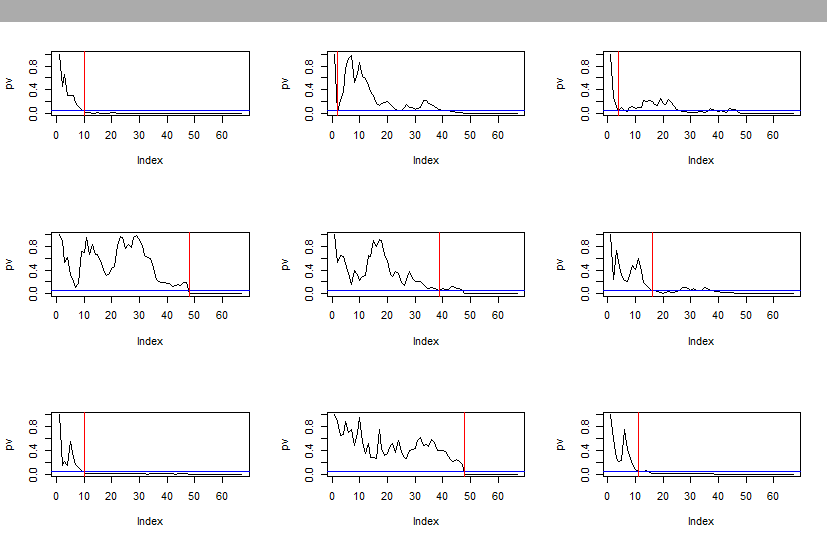
However, the P-values corresponding to t statistics computed after n=2,3,,67 may be smaller than 5% for some values of n smaller than 67.

Below we plots of such 'intermediate' P-values for nine experiments with n=67. About 80% samples will show P-values below 0.05 exactly at n=67. That may be the first step at which the value is small enough to reject, but that is typically not the case. Clearly, it would not be appropriate to make a decision based on the first step at which a P-value is smaller than 5%.

enter image description here

Of course, some of these P-value traces may never dip as low as 0.05 within n=67 observations.

R code for one trace is shown below:

pv = numeric(67)
x = rnorm(67, 100, 15)
pv = numeric(67);  pv[1]= 1  # no t stat for n=1
for(i in 2:47) 
 { pv[i] = t.test(x[1:i], mu=106)$p.val }
plot(pv, type="l", ylim=0:1)
 abline(h=.05, col="blue")
 m = min(which(pv < .05));m
 abline(v=m, col="red") 
2
  • Thank you! I have added a paragraph to the question to clarify what I am after. It is not so much about running tests and stopping but about refining the sample size needed.
    – Ivan
    Commented Aug 19, 2021 at 8:51
  • You retained "Each day, we take the statistics of the control group and perform sample size determination. With each new day passed, we get a better and better understanding of when to stop." That seems almost contradictory to the new last paragraph. // If contemplating a sequential procedure, you have to allow for that in advance. Otherwise establish a protocol based on info you have before you have taken any data specifying the sample size to be used. As my demo shows, changing the sample size based on intermediate "analyses" can lead to misleading conclusions. That point remains relevant.
    – BruceET
    Commented Aug 19, 2021 at 17:08
0

I feel that your statement about study design misrepresents what it is about.

Traditionally, sample size determination is done as part of the design phase. To this end, one has to have an understanding of the baseline performance, such as the mean and standard deviation of the metric in question. One might use recent historical data to obtain reasonable estimates.

Study Design Basics

Study design is all about risk management and should not be based on empirical data such as mean and standard deviation. Rather study design should be based on what is a minimally useful normalised effect size (inter-group difference over intra-group variation) balanced against maximum acceptable risk. If the effect size is useful you want to ensure your experiment detects it at a level of risk that is acceptable to stakeholders. To see why look at a basic sample size calculator:

n=2(Zα+Zβ)2σ2Δ2

Basically we fix a constant by deciding alpha and beta based on stakeholder sensitivity to rejecting null when it is true vs accepting it when it is false. If we use empirical data to fill in σ and Δ, then our calculation will use the same information that we would use to calculate p values, e.g. the t-test calculates

t=Δσ

Which is then transformed into Z scores. You'll notice that t has the same variables, but inverted. I.e. using empirical data in a sample size calculator will simply tell us what we would already know by looking at the p value, albeit in a transformed way.

Proposed approach

The process described in the OP is performing exploratory data analysis and appears to be attempting to use it as confirmatory analysis. To manage risks it seeks to use statistical methods to provide respectability to the output.

One of the critical needs for confirmatory analysis is the concept of independence. Hypotheses need to be tested on data that is independent of the data used to originally generate them, otherwise you end up with familywise errors as the errors at later stages will be implicitly tied to the errors at the early stage since the variation in the early samples persists and influences all subsequent analyses. The process in the OP cannot be used to provide falsification of the hypothesis that the experiment is itself generating. If you look at the basic formula for sample size calculation above this becomes clear.

Apart from the fact that one might launch an experiment that is doomed to fail, are there any other problems with the above logic? Of course, we are not assuming a clinical setting but rather a service of some kind.

Launching an experiment doomed to fail is probably the most insignificant possible problem as all that is wasted is the resource put into the experiment. A much bigger risk is that the experiment leads to an inappropriately weighted decision that misunderstood the magnitude of risk and led to an overconfident response. Here the effect goes way beyond the resource associated with performing the experiment. A couple of examples of what it may lead to committal of:

  • new investment in something flawed that will fail
  • cancelling a product that could have made a positive impact
  • releasing a product or service that has a negative impact on users
  • fraud, if the risks were willfully not clearly detailed

Many proof of concepts start out life using informal or semi-formal processes similar to what is described in the OP. However, it must be clear to all stakeholders that it is exploratory in nature and unconfirmed by independent testing. It would be advisable to undertake a statistical design of the process to be sure you understand the risks, but to be honest this sounds like a much more difficult job than a standard study design approach based on first understanding stakeholder needs, risks and benefits. The amount of effort put into this should be proportional to the expected risk/benefits of the final use case of the research outputs. Changing the colour of a web site button probably warrants 2 minutes within a design meeting to establish these, whereas a medical device will require domain experts and a full benefit-risk analysis.

When presenting output of the analysis it must be qualified and the appropriate caveats must be attached to all downstream decisions and recommendations. All stakeholders (anyone affected by the decisions in any way) should be made fully aware of the risk associated with the data.

Conclusion

It would be difficult to see how to justify the approach without a much more robust defence and a mathematical/statistical proof of how it performs. This would be much more work than it is proposing to save.

2
  • Thank you! I am still trying to understand if I phrased the question correctly. Take, for instance, the formula you gave and assume a minimal effect size that is still of interest to detect. What remains for the calculation is the variance. One might just have a good estimate off the top of one’s head or have to do a calculation. In the latter case, representative historical data might be used. What I am asking in the question, would it be sound to use the control group to estimate this variance, as it comes from the right context and at the right time, i.e., very much representative?
    – Ivan
    Commented Aug 23, 2021 at 10:53
  • If the application is such low risk then why do you need a rigorous statistical design? Are there no rules of thumb used in the application area? The point is if you feed empirical results from your ongoing experiment back into a continuous sample size estimator you will end up propagating the errors collected in the experiment into your stopping decision, compounding the risks. This feedback loop is pointless and more likely to cause serious errors. If it is impossible to set parameters without empirical estimates, then do a small initial study then exclude that data from the next analysis.
    – ReneBt
    Commented Aug 23, 2021 at 11:21
0

Maybe it's me, but I feel all the answers here completely missed the point.

Correct me if I'm wrong - you want to update the sample size estimate by using statistics from the control group instead of calculating it once using pre-experiment statistics? So the question here is not about stopping the experiment, but about estimating control group statistics, which is what pre-experiment mean/variance is doing anyway.

So, for sample size calculation you need an MDE, alpha, beta, variance (or mean, if you have a proportional - i.e. Bernoulli - variable). Keeping alpha, beta and MDE fixed as part of the experiment design, you update the sample size based on the control mean/variance estimates.

I think this should be equivalent to the pre-experiment estimate if SUTVA is satisfied, and there are no other effects causing the change in the control group. But then, if there are, they would be there anyway, and your pre-experiment estimate wouldn't correspond to the control group statistics.

The only caveat I can see is that the pre-experiment estimate will be more reliable as you can have a higher sample size, thus lowering the confidence interval and getting an estimate close to the "true" mean/variance. This is important, because at worst case, you can get an underpowered experiment, which has quite a lot of caveats, for example, overestimated effect in case of a significant result.

It's an interesting question, and would be nice to see some proofs and simulations (I might perform some soon). But in general, I think it's all about how fast the estimate of mean/variance converges to the "true" mean using control group data, and if you have enough data to estimate it reliably.

-1

The fundamental problem is the phrase "we get a better and better understanding of when to stop." On what basis do you decide "when to stop?"

What you propose is that each day (after you have collected some new data) "we take the statistics of the control group and perform sample size determination." But this doesn't seem to make sense, since "determining sample size" (power analysis) takes a certain error tolerance, standard deviation and alpha as inputs and gives you the N that you need to estimate a quantity within that tolerance. As you note this is obviously a useful analysis to run BEFORE You design the study. But in your case, each day you already KNOW whatever new, larger sample size you have as of that day. So if the output of the formula is already known, what exactly are you doing "each day?" What exactly do you put into this formula each day and what value are you expecting to get out?

My guess is that what you really meant to say is "each day I calculate confidence intervals around the control group using the data that I've collected up to that point, and when the confidence intervals get small enough I stop collecting new data."

But this is where you get into trouble, because what criteria could you use to decide if the confidence intervals are "small enough" to stop collecting new data?

If you are "running an experiment" then the goal is presumably to test a hypotheses: is the treatment group significantly different from the control group, with respect to some outcome (at a certain level of confidence). Obviously you could say "I'm going to keep collecting data until the confidence intervals around the control group no longer overlap with the estimate for the treatment group." which would obviously undermine the logic of significance testing for the reasons that others have described. But if you don't want to use this as your criteria then what else could you do?

If you just want to say "I'll stop collecting data when my Confidence intervals are less than X points wide" that's fine....but in that case you are back to where you started, since you could have done this before you started collecting data: that's what power analysis is for after all!

Here's the question you have to answer: what "new information" would you get each day that would help you decide "when to stop" that you didn't already know before hand, but which is also NOT related to the hypothesis you are trying to test?

4
  • Thank you! I am thinking as follows. Let us take ReneBt’s formulae. To perform power analysis, one has to specify σ2. One solution is to look at the data for, say, the month preceding the experiment and speculate it captures the metric’s variability well enough for the analysis to be meaningful. Another solution is to calculate the variance on the control group. The benefit I see is that it would correspond to the right context and at the right time, compared to some arbitrary time interval in the past. I would like to understand why this is inadequate.
    – Ivan
    Commented Aug 23, 2021 at 14:21
  • So you are saying that you keep collecting data until your estimate of the variance is "good enough?" How do you know when that is? What is the "cut off"? Also, one of the benefit of power analysis is that you can try a RANGE of variances and see how much it matters. It might show you that you will need 560 cases if the variance the lowest plausible value but 720 cases if the variance is the highest plausible value. These are all things you should just consider before starting the study. Commented Aug 23, 2021 at 15:48
  • Also I think the underlying objection to your approach is is that, for statisticians the risk of (intentionally or unintentionally) biasing results by making ad hoc decisions about whether to keep collecting data during the study is FAR FAR FAR more dangerous than the risk of getting the variance "wrong" in a power analysis calculator. If you just throw in a big variance guess the "worst" that can happen is you have an over powered study., which isn't actually that bad. But if you try to decide when to stop collecting data you might fatally bias your results. Commented Aug 23, 2021 at 15:54
  • Presumably the analyst could use a pre-specified "stopping rule" and that rule could be investigated to ensure it doesn't bias the analysis.
    – Ben
    Commented Aug 28, 2021 at 21:24

Your Answer

By clicking “Post Your Answer”, you agree to our terms of service and acknowledge you have read our privacy policy.

Not the answer you're looking for? Browse other questions tagged or ask your own question.