4
$\begingroup$

I have a dataset, containing some trees and the estimated upper and lower bounds of their ages. For example, tree #1 is 10~15 years old, and tree #2 is 13~20 years old, etc. I want to visualize the data.

I know that I can calculate the mean values of the bounds and plot a histogram. However, the plot would be more useful if the upper and lower bounds are also presented, since it shows the uncertainty of our estimations. How should I do that? Or is this even possible or reasonable?

My original thought is that the x-axis should be the ages and the y-axis should be the number of trees, which is the same as the histogram, but I'm not whether using these axes are possible or practical.

The followings are some samples from the dataset (unrelated columns are omitted):

Tree ID Estimated ages (year) (lower bound) Estimated ages (year) (upper bound)
1 10 15
2 13 20
3 1 3
4 7 16
5 13 15
6 12 18
$\endgroup$
7
  • 1
    $\begingroup$ Have you thought of boxplots? $\endgroup$
    – Pitouille
    Commented Oct 4, 2021 at 9:27
  • $\begingroup$ More detail needed. Suppose one tree is 12-16 years old and another 10-18 years old, so the interval midpoint is the same. Do those trees count as the same or different? You say you want to show the uncertainty on the graph too, but it's hard to know how to combine that with what you specify as axes. How many trees do you have, as that makes a difference to what is practical? $\endgroup$
    – Nick Cox
    Commented Oct 4, 2021 at 9:28
  • 1
    $\begingroup$ As @NickCox mentioned, we need to know more about your data... I think I misread your question thinking that trees belong to a category and then visualize them through boxplot... but it is actually different... $\endgroup$
    – Pitouille
    Commented Oct 4, 2021 at 9:43
  • 1
    $\begingroup$ @Pitouille Thanks for your advice. I've edited the question to elaborate more and also attached some samples. Hope this helps. $\endgroup$
    – Allen
    Commented Oct 4, 2021 at 9:54
  • 1
    $\begingroup$ What you show is one sample to statistical people and several samples to a biologist.... (A small deal, but watch out.) $\endgroup$
    – Nick Cox
    Commented Oct 4, 2021 at 9:55

2 Answers 2

6
$\begingroup$

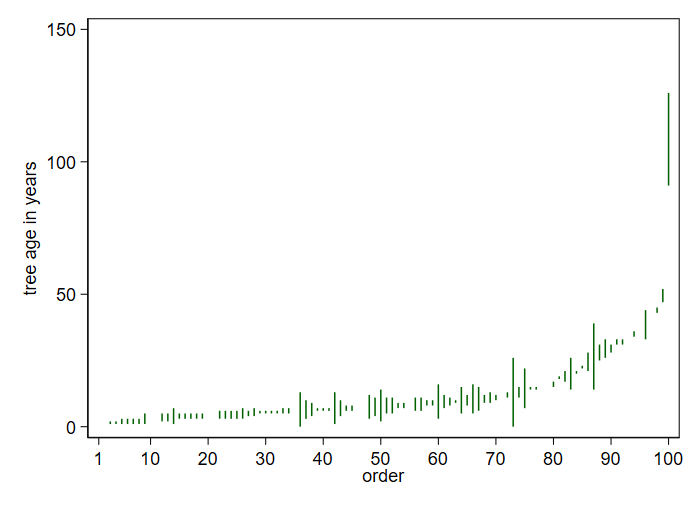
You could plot each tree's interval but sort on interval midpoint at least. The "data" here are fake; I didn't have any sight of your data when I did this.

This is in effect a quantile plot with added information on uncertainty. Adding points at the midpoints and/or connecting them with a line would emphasize the overall distribution more.

Many other variations are possible. For example, if age in the data is always positive, then a transformed scale might help.

enter image description here

$\endgroup$
2
$\begingroup$

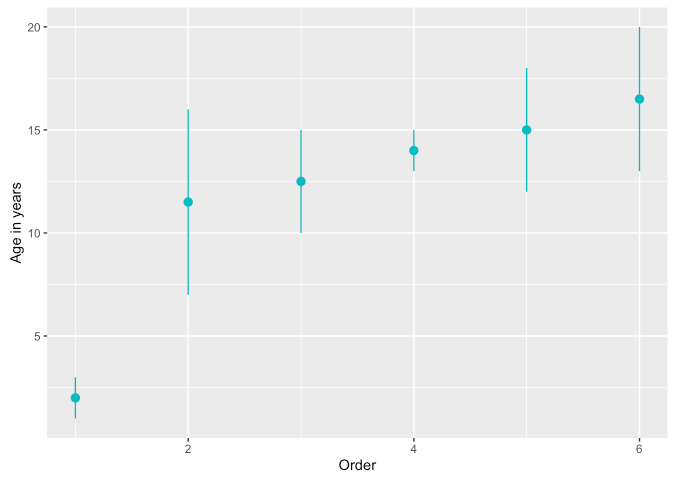
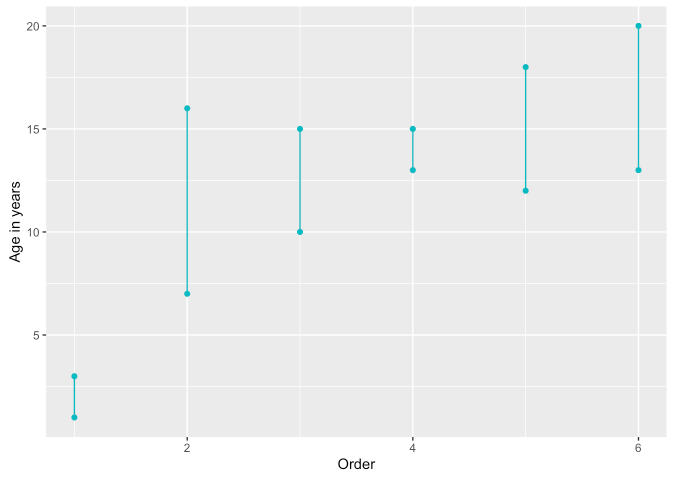
Following @Nick Cox's answer (and comments - EDIT), some examples in R:

tree <- data.frame(c(1,2,3,4,5,6), c(10,13,1,7,13,12), c(15,20,3,16,15,18))

names(tree)[1]<-"TreeID"
names(tree)[2]<-"Lower"
names(tree)[3]<-"Upper"

tree <- cbind(tree, (tree$Lower + tree$Upper)/2)
names(tree)[4]<-"Avg"
tree <- cbind(tree[order(tree$Avg),], 1:6)
names(tree)[5]<-"Order"

library(ggplot2)

ggplot(tree, aes(x=Order, y=Avg)) +
  geom_pointrange(aes(ymin=Lower, ymax=Upper), color="#07bbc1") +
  labs(x="Order", y = "Age in years")

enter image description here

ggplot(tree, aes(x=Order, y=Lower)) +
  geom_segment(aes(xend = Order, yend = Upper), color="#07bbc1") +
  geom_point(color="#07bbc1") +
  geom_point(aes(y = Upper), color="#07bbc1")+
  labs(x="Order", y = "Age in years")

enter image description here

$\endgroup$
2
  • 1
    $\begingroup$ It is best to avoid using identifier as an axis unless that has a meaning. It's evident that the OP is interested in the frequency or probability distribution. $\endgroup$
    – Nick Cox
    Commented Oct 4, 2021 at 12:30
  • $\begingroup$ @NickCox, I included your comments. Thanks! $\endgroup$
    – Pitouille
    Commented Oct 4, 2021 at 12:48

Your Answer

By clicking “Post Your Answer”, you agree to our terms of service and acknowledge you have read our privacy policy.

Not the answer you're looking for? Browse other questions tagged or ask your own question.