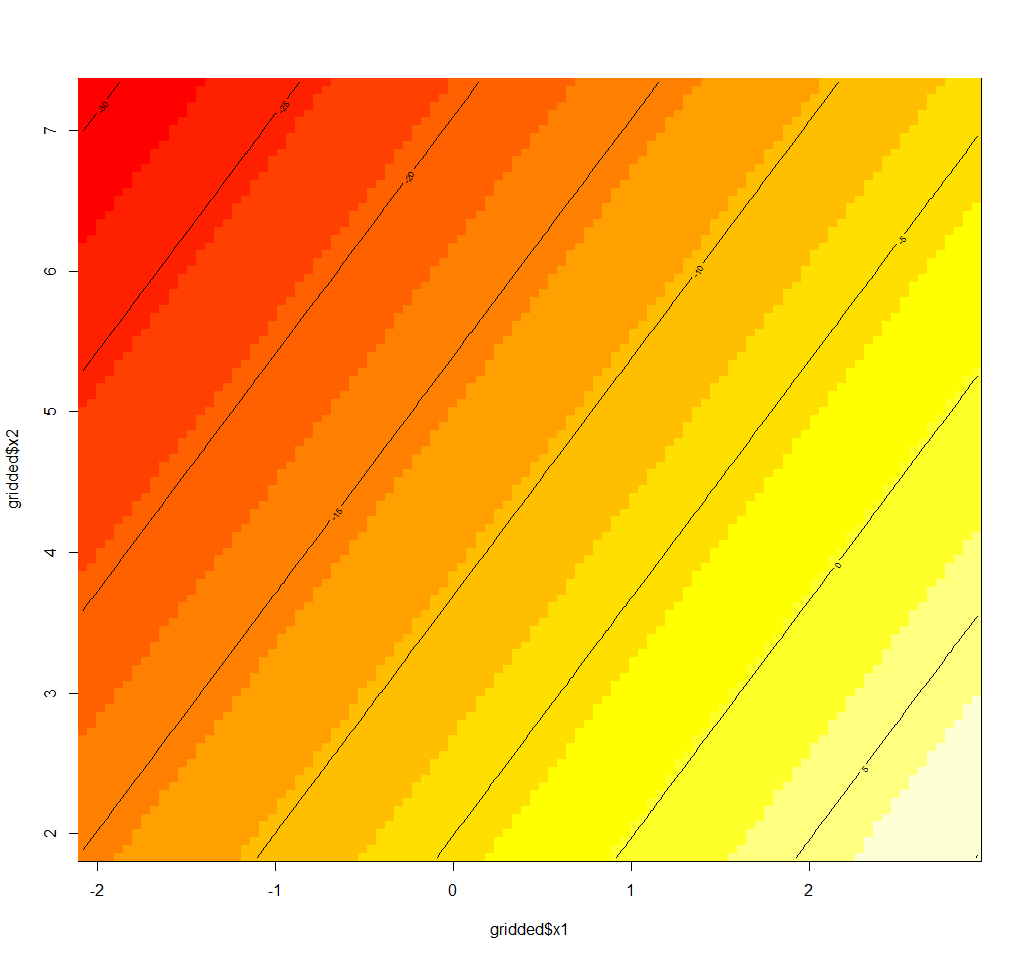
I want to plot the results of a regression model, but allowing two variable to vary simultaneously. I guess I could do that using predict() function in R, but I am running a model that does not have such function developed yet.
Let's suppose we have a data set
x1 <- rnorm(100)
x2 <- rnorm(100)
y <- 1 + x1*5 + x2*3 + rnorm(100)
And we run a simple model and calculate yhat.
mod <- lm(y ~ x1 + x2)
yhat <- predict(mod)
dt <- as.data.frame(cbind(yhat,x1,x2))
How can I plot the expected value of y for different values of x1 and x2? I tried this, but it didn't work:
contour(dt$x1, dt$x2, dt$yhat)

Error in contour.default(dt$x1, dt$x2, dt$yhat) :
  increasing 'x' and 'y' values expected

