3
$\begingroup$

I have a 2X2 factorial experiment where I am interested in seeing the effect of two different nutrient solutions (N and W) on the appearance of root tips of two different plant species (A and B). I used 3 plants per species X treatment combination. I took daily counts of the number of root tips of each plant over the course of 9 days. The data look like this.
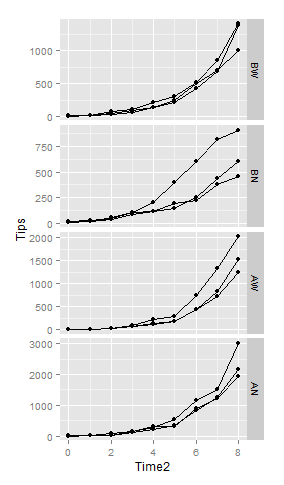
enter image description here

I have never worked with discrete data before. I was thinking of fitting an exponential growth function such as:

Tips=T0e^rt

, where T0 is the number of tips at time 0 (the observed initial number of tips), r is the relative rate of addition of new tips and t is time (in days, considered continuous?), and see if there were differences in the r parameter between my species X treatment combinations (or if there are only main effects…). Any suggestions? I know I will have to account for issues such as correlated observations and having (random?) subject-specific effects on the model parameters. I have no idea how to do this in the context of discrete data analysis, and would really appreciate any suggestions of potential models to use, pitfalls and references that would give me some background.

$\endgroup$

1 Answer 1

2
$\begingroup$

A few possible pointers:

First some very simple things -

If the data are nondecreasing, an obvious first step would be to look at the differences $Y_t - Y_{t-1}$ (which will also be discrete)

- why? because the observed count is the previous count + growth; the consecutive values will be very highly correlated, akin to an integrated series.

Even after differences, you might consider the previous value as an offset in a Poisson GLM perhaps.

For more appropriate models, you might want to look into growth curve models on longitudinal count data (initially, via google). It's a pretty big area.

Mixed-effects models are very common on this sort of data.

[Alternatively, you might want to consider some of the work on birth processes, also directly connected with the Poisson process. If it's possible for the counts to decrease, birth-death processes might be relevant.]

$\endgroup$
1
  • $\begingroup$ Thanks for the input, Glen. I will look into your pointers and get back to the question. $\endgroup$
    – Pedro
    Commented Apr 17, 2013 at 14:37

Your Answer

By clicking “Post Your Answer”, you agree to our terms of service and acknowledge you have read our privacy policy.

Not the answer you're looking for? Browse other questions tagged or ask your own question.