3
$\begingroup$

Given $X_1, X_2,..., X_n $ i.i.d. random variables.

$E[X_i] = \mu_1 \in \mathbb{R} $ $\&$ $ V[X_i] = \sigma_1^2 \in \mathbb{R}^+$ $\forall i \in \{1,2,3,...,n\}$.

The statistics $\bar{X} = \frac{X_1 + X_2 + ... + X_n}{n}$ converges in distribution to $Z_1 \sim N(\mu_1, \frac{\sigma_1^2}{n}$) according to the Central Limit Theorem.

Does $\frac{1}{\bar{X}}$ converge in distribution to $\frac{1}{Z_1}$?

I guess the answer is NO, but I decided to ask the question here for more insights. A simple yes/no answer without any explanation would be appreciated too.

The reason I ask this question is relevant to ratio estimator in survey sampling as I read in some books that we could assume the ratio estimator $\hat{R} = \frac{\bar{X}}{\bar{Y}}$ to be normally distributed.

If I am not mistaken, if $X_n$ converges in distribution to $X$, and $Y_n$ converges in distribution to $Y$, then $X_nY_n$ converges in distribution to $XY$

Given $Y_1, Y_2,..., Y_n $ i.i.d. random variables.

$E[Y_i] = \mu_2 \in \mathbb{R} $ $\&$ $ V[Y_i] = \sigma_2^2 \in \mathbb{R}^+$ $\forall i \in \{1,2,3,...,n\}$.

The statistics $\bar{Y}$ converges in distribution to $Z_2 \sim N(\mu_2, \frac{\sigma_2^2}{n}$) according to the Central Limit Theorem.

If $\frac{1}{\bar{Y}}$ converges in distribution to $\frac{1}{Z_2}$, $\frac{\bar{X}}{\bar{Y}}$ converges in distribution to $\frac{Z_1}{Z_2}$, which is a fat-tailed "Cauchy" distribution with not well-defined expected value and variance.

Therefore, it is incorrect to assume that the ratio estimator $\hat{R} = \frac{\bar{X}}{\bar{Y}}$ is normally distributed.

$\endgroup$
4

1 Answer 1

3
$\begingroup$

Does $\frac{1}{\bar{X}}$ converge in distribution to $\frac{1}{N(\mu_1, \frac{\sigma_1^2}{n})}$?

No, because $\frac{1}{N(\mu_1, \frac{\sigma_1^2}{n})}$ is not a distribution/variable, and so it is not something that a sequence of distributions/variables can converge to.

You could alternatively describe the following two convergence behaviours

When $\mu_1 = 0$

You might be thinking of the reciprocal normal distribution. When $\mu_1 = 0$ then you can have some expression where the reciprocal normal distribution is what the sequence converges to.

Let $Y \sim N(0,1)$ then $\frac{\sqrt{n}}{\sigma} \bar{X}_n \xrightarrow{P} Y $ so we could have $$\frac{\sigma}{\sqrt{n}} \frac{1}{ \bar{X}_n} \xrightarrow{D} \frac{1}{Y}$$

without this additional factor $\frac{\sigma}{\sqrt{n}}$ the sequence does not converge to anything because you get a sequence of distributions with an increasing variance. Eventually the distribution function converges to zero in every point (but zero in the entire range is not a distribution).

When $\mu_1 \neq 0$

In this case the we can make a Taylor series approximation in the point $x = \mu_1$

$$\frac{1}{x} \approx \frac{1}{\mu} - \frac{1}{\mu^2} (x-\mu)$$

and we can approximate the variable $1/\bar{X}_n$ with this

$$ \frac{\sqrt{n}}{\sigma}\left[\mu_1^2\left( {\frac{1}{\bar{X}_n}-\frac{1}{\mu_1}}\right) \right]\approx \frac{\sqrt{n}}{\sigma}\left[\bar{X}_n - \mu_1 \right] \xrightarrow{D} N(0,1)$$

or re-arranging the terms a bit

$$ \frac{\mu_1^2\sqrt{n}}{\sigma} \frac{1}{\bar{X}_n} - \frac{\mu_1\sqrt{n}}{\sigma} \xrightarrow{D} N(0,1)$$

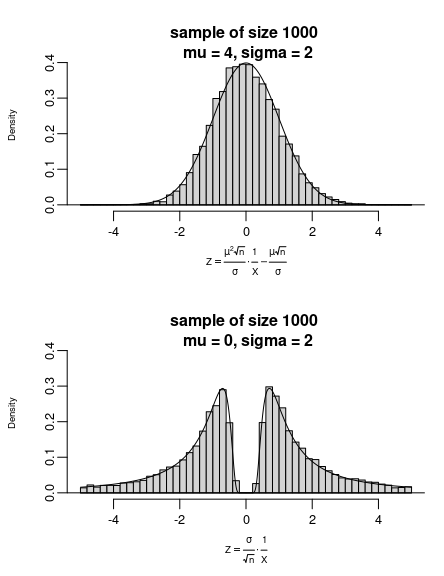
Histograms of simulations

The simulations below show that there is a reasonable agreement between the histogram for sample sizes of 1000 and the limiting distributions.

comparison with samples of size 1000

The case when $\mu_1 = 0$ is actually interesting. When $\mu_1 \approx 0$ (ie. $|\mu_1| << \sigma$), then the convergence is very slow and for small samples you get that the reciprocal normal distribution can also be used as an approximation.

simulate1 = function(n1, n2, mu, sig, xlab = "") {
  
  X = matrix(rnorm(n1*n2,mu,sig), nrow = n2)
  X_m = rowMeans(X)
  Y = 1/X_m
  Z = mu^2*sqrt(n1)/sig * Y - mu*sqrt(n1)/sig
  
  hist(Z, breaks = c(-10^9,seq(-5,5,0.2),10^9), xlim = c(-5,5), ylim = c(0,0.45), freq = 0, main = "", xlab = xlab,
       cex.lab = 0.6, cex.axis = 0.8)
  Z
}

set.seed(1)
Z = simulate1(10^3, 10^4, 4, 2, xlab = expression(Z == over(mu^2*sqrt(n),sigma) %.% over(1,X) - over(mu* sqrt(n),sigma)))
t = seq(-5,5,0.01)
lines(t,dnorm(t))
title("sample of size 1000 \n mu = 4, sigma = 2", cex.main = 1, line = -1)


simulate2 = function(n1, n2, mu, sig, xlab = "") {
  
  X = matrix(rnorm(n1*n2,mu,sig), nrow = n2)
  X_m = rowMeans(X)
  Y = 1/X_m
  Z = sig/sqrt(n1) * Y 
  
  hist(Z, breaks = c(-10^9,seq(-5,5,0.2),10^9), xlim = c(-5,5), ylim = c(0,0.45), freq = 0, main = "", xlab = xlab,
       cex.lab = 0.6, cex.axis = 0.8)
  Z
}

set.seed(1)
Z = simulate2(10^3, 10^4, 0, 2, xlab = expression(Z == over(sigma,sqrt(n)) %.% over(1,X)))
t = seq(-5,5,0.01)
lines(t,1/t^2/sqrt(2*pi) * exp(-1/2/t^2) )
title("sample of size 1000 \n mu = 0, sigma = 2", cex.main = 1, line = -1)
$\endgroup$
4
  • $\begingroup$ Thanks for your detailed answer! I really appreciate that. I managed to understand some parts of your answer. Anyway, i just edited my question by using more "accurate" notations. Can you take a look at it again? Thank you so much! $\endgroup$
    – user340483
    Commented Jun 7, 2022 at 11:47
  • 1
    $\begingroup$ @mathworkswizard your new expressions are still difficult. You ask whether $1/\bar{X}$ converges to $1/Z$, but $1/Z$ is not a fixed distribution. That makes it ambiguous what is meant with convergence. That's why in my answer I use two parameters and look at the convergence of $$a_n \frac{1}{\bar{X}_n} + b_n$$ where one needs a suitable choice of $a_n$ and $b_n$ to get a converging sequence of distributions. $\endgroup$ Commented Jun 7, 2022 at 12:14
  • 1
    $\begingroup$ The problem is that I can make any distribution $X$ converge to a distribution $Z$ by letting the $X_1, X_2, \dots, X_n$ and $Z_1, Z_2, \dots, Z_n $ be both a sequence of variables that converge towards a single point. For instance imagine, a normal distribution with standard deviation $\sigma = 1/n$ and a Cauchy distribution with scale parameter $\gamma = 1/n$. These distributions of these variables will converge to zero everywhere except in the point of the location parameter $\mu$. So then you could say that the distributions converge to each other? $\endgroup$ Commented Jun 7, 2022 at 12:14
  • $\begingroup$ Thank you so much! I will read it when I get home. Your answer is great anyway! $\endgroup$
    – user340483
    Commented Jun 7, 2022 at 12:51

Your Answer

By clicking “Post Your Answer”, you agree to our terms of service and acknowledge you have read our privacy policy.