0
$\begingroup$

I want to perform an ANOVA test on a mixed linear model.

I have variable response "CK" measured in 2 independant conditions: -2 groups of horses (independant variable : Groupe: Groupe 1 and Groupe 2 : between) -at 2 time points for each subject (independant variable : Temps: T0 and T4, within subject: repeated measures)

Here is my dataset: data

I want to perform a two way anova (on Groupe and Time) with post-hocs tests. I built a mixed linear model :

model <- lme(**CK~Temps*Groupe, random=~1|Cheval**,data=data, na.action=na.omit)

and perfomed an ANOVA test on the model

anova(modelCK, type = "marginal")

summary(modelCK)

From this; I only have a significant effect of Time. Now I want to do the post-hocs test to know where are the significant differences.

My question is; I tried few options to get the Post-hoc tests and got different results. I am confused and don't know what to keep.

***I started using emmeans:

emmeans(modelCK, pairwise~Temps, adjust = "bonferroni")

emmeans(modelCK, pairwise~Groupe, adjust = "bonferroni")

emmeans(modelCK, list(pairwise~ Groupe | Temps),adjust = "bonferroni")

emmeans(modelCK, list(pairwise~ Temps| Groupe),adjust = "bonferroni")

I found a significant difference at T4 between Group 1 and Group 2 I found a significant difference for Group 1 (only, not Group2) between T0 and T4.

***Then I used lsmeans

summary( lsmeans( model, pairwise ~ Groupe*Temps), infer=TRUE)

Here I don't find the difference at T4 between Group 1 and Group 2 But I found a difference for Group 2 between T0 and T4, on top of the one for Group 1.

***Then I used combination of one-way Anova with posthoc t-test

For the between-subject factor (Group):

one.way <- data %>% 
           group_by(Temps) %>% 
           anova_test(dv = CK, wid = Cheval, between = Groupe) %>% 
           get_anova_table() %>%  
           adjust_pvalue(method = "bonferroni")

pwc <- data %>% group_by(Temps) %>% pairwise_t_test(CK ~ Groupe, p.adjust.method = "bonferroni") pwc

There is no significant difference at T4 between the groups.

And for the within subject factor (Time):

one.way2 <- data %>% group_by(Groupe) %>% anova_test(dv = CK, wid = Cheval, within = Temps) %>% get_anova_table() %>% adjust_pvalue(method = "bonferroni")


pwc2 <- data %>%
     group_by(Groupe) %>%
     pairwise_t_test(CK ~ Temps, paired = TRUE, p.adjust.method = "bonferroni") %>%
     select(-df, -statistic, -p) pwc2

Here I found difference for Groupe 1 and Groupe 2 on values between T0 and T4.

Why there is so many differences on results depending on the function used? Are my codes appropriate?

Thank you in advance,

Regards,


Édit :

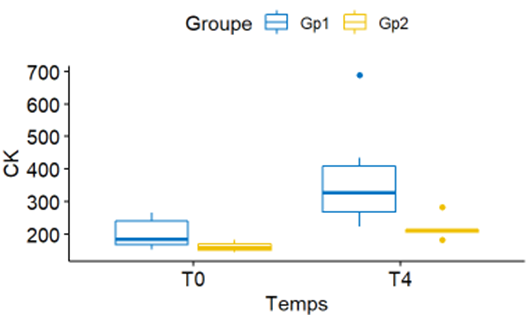
A graph may clarify my questions

enter image description here

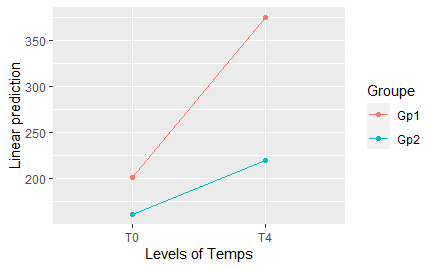
emmip function

I want to investigate if the CK parameter increased significantly with time (Temps) and if the increase is different depending the Group (Groupe). Actually just to compare the 4 conditions presented on that boxplot

$\endgroup$
2
  • 1
    $\begingroup$ Please don't upload code, error messages, results or data as images for these reasons - and these. $\endgroup$
    – Limey
    Commented Aug 4, 2022 at 14:16
  • $\begingroup$ The lsmeans package is being deprecated, so use the emmeans package instead. Whether you use pairwise comparisons for Temps or for Temps | Groups or for Temps*Groups depends on what you want to know. $\endgroup$ Commented Aug 4, 2022 at 15:14

1 Answer 1

2
$\begingroup$

Just some quick points...

  1. The one-way methods you are trying do not use the model you have fitted. They are based on much simpler models, and ignore parts of the data. I recommend against them.

  2. There is no difference between lsmeans() and emmeans() except for the column headings in the results. So if you got different results from these two functions with the same specs, it means you changed the model or made a mistake somewhere along the line. (lsmeans is just an older term and its implied "least squares" is not always approriate to the models it can handle.)

  3. If you ask different questions, you get different answers. So you should think first about what questions you want to ask, rather than letting the tail wag the dog by comparing answers to different questions.

    (a) I suggest doing something like emmip(modelCK, Groupe ~ Temps) to give you an idea of what the model is telling you.

    (b) The results from the anova are not displayed, so I can only guess what's right. But the first thing to look at is the interaction. If that really is unimportant (not just non-significant), then you should do marginal means of each factor and comparisons thereof (the first two emmeans calls shown. But consider first re-fitting the model with the interaction removed (CK ~ Temps + Groupe).

    (c) If the interaction cannot be ignored, then that suggests the conditional ones shown. The latter are more detailed and so should be avoided if not needed.

  4. Using adjust = "bonf" gives you an unduly conservative adjustment. I suggest just taking that out and use the default Tukey adjustment.

  5. Consider finding a consultant. Many stat departments can connect you with one. Statistics is more than running programs. How important is it to you that your research results are interpreted correctly?

$\endgroup$
6
  • $\begingroup$ Hello, Thank you very much for you valuable time, really appreciated. Sorry for my unclear post and questions. Indeed the one-way tests are not appropriate. The emmip function helped me to see better what my model does. As seen in that graph, there is no interaction between Temps and Groupe. That is also what I found with anova on the modelCK. There is a significant effect of factor Temps, but not of Groupe. $\endgroup$
    – Maelleb26
    Commented Aug 5, 2022 at 7:59
  • $\begingroup$ -With the Anova results, the significant effect of Time found, is about Groupe 1, Groupe 2, or both groups? How can I investigate that question? Thank you very much, I usually am in contact with a stat departments but they are not available during holidays, just trying to keep going :) $\endgroup$
    – Maelleb26
    Commented Aug 5, 2022 at 8:08
  • $\begingroup$ You say in the first comment "[a]s seen in that graph, there is no interaction between Temps and Groupe." But in your second comment, "....effect of Time found, is about Groupe 1, Groupe 2, or both groups?"; and in the edited post you say you want to see "if the increase is different depending the Group (Groupe)." Do you understand that the latter statements express a wish to investigate the interaction? So you said conflicting things. $\endgroup$
    – Russ Lenth
    Commented Aug 5, 2022 at 17:02
  • $\begingroup$ Sorry I try to explain my question better. I am not sure what I can conclude or not from the model. There is no interaction between time and groupe. There is effect of time. From that effect of time I can conclude that the parameter increase significantly with time. What does the main effect calculation use as data; all subjects values regardless the groups? Or datas from each group? As there is no interaction I can not say if increases is in both group or one group? $\endgroup$
    – Maelleb26
    Commented Aug 5, 2022 at 21:16
  • $\begingroup$ That is a cadre less interpretation. Just because something isn't statistically significant doesn't mean it is not there,it just means you can't prove it with enough certainty. In the plot, it appears there is a pretty strong interaction. it'd be interesting to see if it holds up if you collect more data. $\endgroup$
    – Russ Lenth
    Commented Aug 5, 2022 at 21:38

Your Answer

By clicking “Post Your Answer”, you agree to our terms of service and acknowledge you have read our privacy policy.

Not the answer you're looking for? Browse other questions tagged or ask your own question.