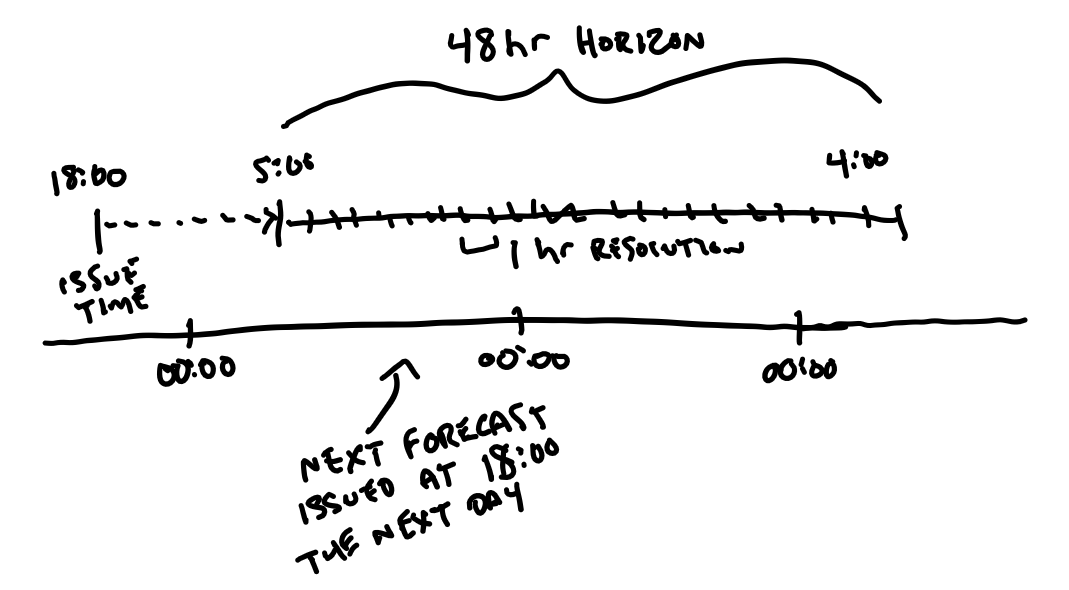
The ARPA-E PERFORM datasets produced by NREL contain both historical and forecast data on load, wind power, and solar power. NREL offers the following piece of information about the day-ahead forecast data:
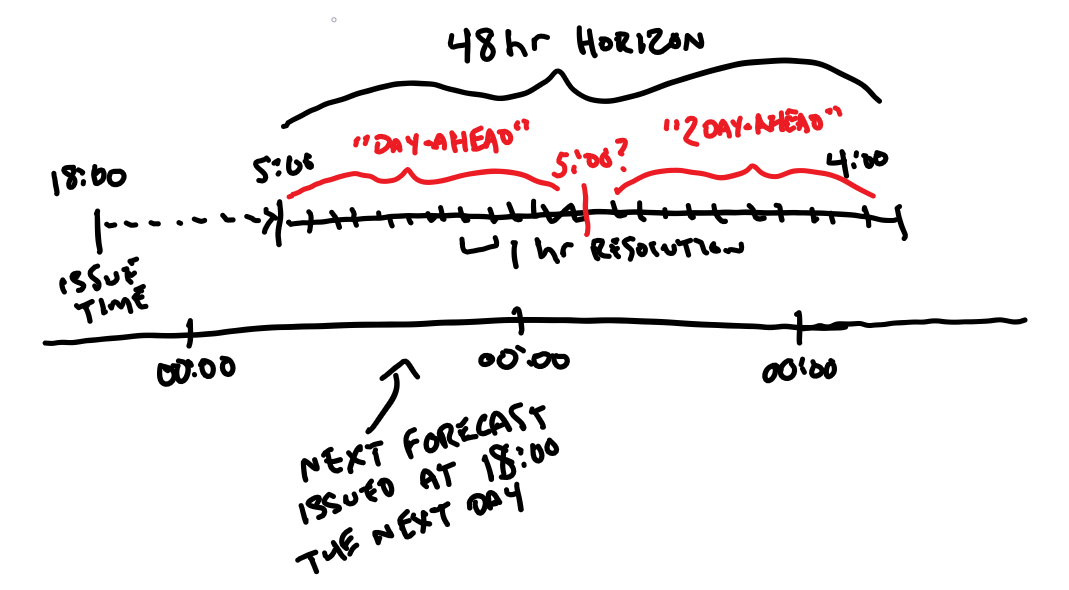
Day-ahead forecasts are generated with a 11-hour-ahead lead time, a 48-hour horizon, an hourly resolution, and a daily update rate.
I downloaded the data for wind power in ERCOT (2018) and the two first columns with issue time and forecast time, respectively, are shown below with the first few rows of the dataset (Forecasts quantiles are not included).
| Issue time | Forecast time |
|---|---|
| 2017-12-30 18:00:00 | 2018-01-01 00:00:00 |
| 2017-12-30 18:00:00 | 2018-01-01 01:00:00 |
| 2017-12-30 18:00:00 | 2018-01-01 02:00:00 |
| 2017-12-30 18:00:00 | 2018-01-01 03:00:00 |
| $\vdots$ | $\vdots$ |
| 2017-12-31 18:00:00 | 2018-01-01 06:00:00 |
Given the American Meteorological Society's definition of lead time as "the length of time between the issuance of a forecast and the occurrence of the phenomena that were predicted", I assumed that the difference between the forecast time and the issue time had to be 11 hours. However, from row 1 in the table above, we could see that such difference is 30 hours. For the second row, it's 31 hours. In row seven, we have a difference of 12 hours.
When I saw the issue time was the same for various forecasts, I knew my understanding of forecasting and its nomenclature would be tested. I realized that if I have to choose a set of all forecasts for a fixed $n$ hours ahead, given any $n = 1, 2, ..., 48$, I wouldn't be sure of what forecasts (rows) to select.
There is something I am missing and that's what I'd like understand. What is the lead time here? And what does the difference between the forecast time and the issue mean in this case?


