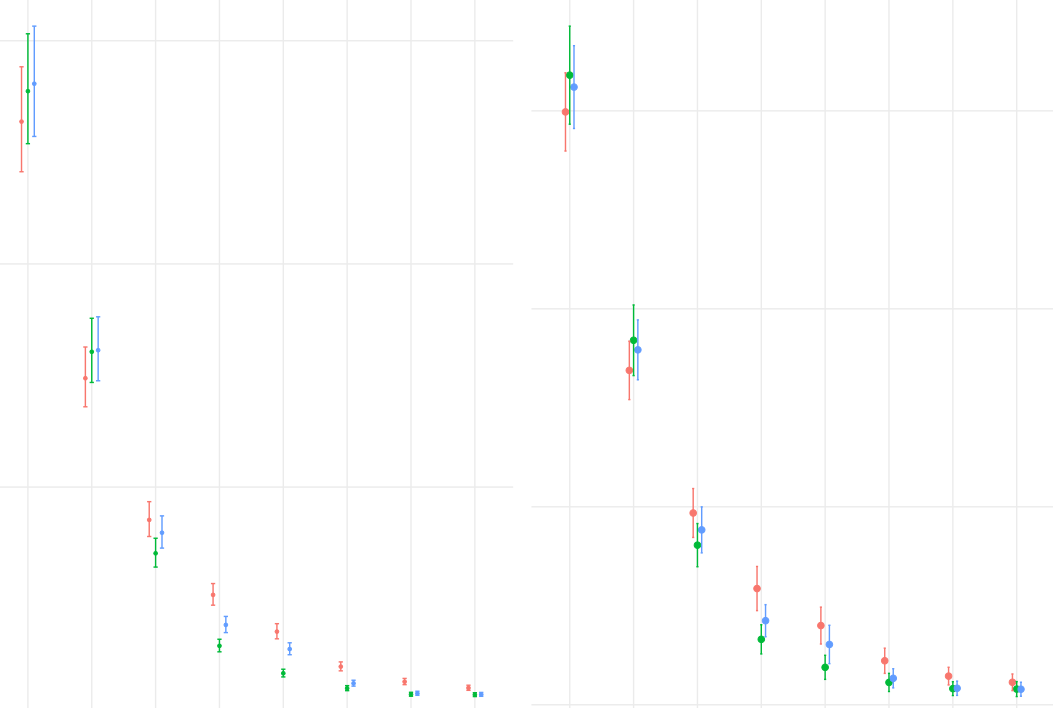
I have a longitudinal dataset with continuous variables for 6 different time points nested within each ID. I prepared a longitudinal Poisson model with ID as a random effect for the intercepts, which in itself is working fine. In preparing the figures for the report, I prepared a figure with the predicted values for each of the 6 timepoints and the confidence intervals derived from the model. Then I grew uncertain and started looking in the literature. I could not really decipher what other people had done for their confidence intervals since it was not shared in the methods section or figure legend. Looking at some of these figures I am left wondering whether some have just reported either means or medians with 95%CI or IQR. I guess median/IQR could be defended, but if means and CI´s are reported, wouldn't the confidence interval be biased due to within-subject correlation?
So I guess my question is if I should use my calculated confidence intervals from the model (with ID as a random intercept) or if there is another universally accepted way of doing this that I have missed?
Thanks for the input regarding confidence and prediction intervals. What I am looking for is the most appropriate way of demonstrating the uncertainty of our measurements over time in three groups - see figure - whether I should include the fact that the measurements are correlated over time or not.

Left is Poisson based fitted population level values and to the right is means and confidence intervals for each time point disregarding the within-subject correlation
