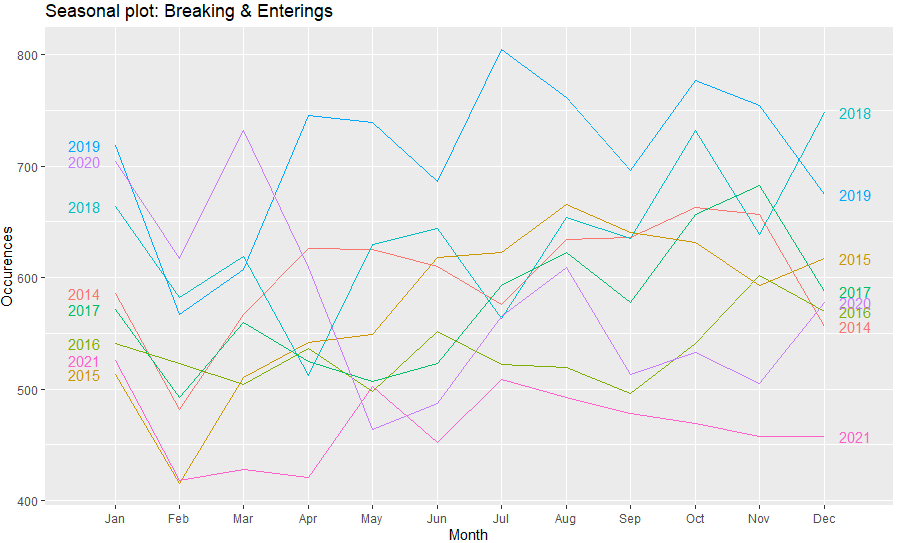
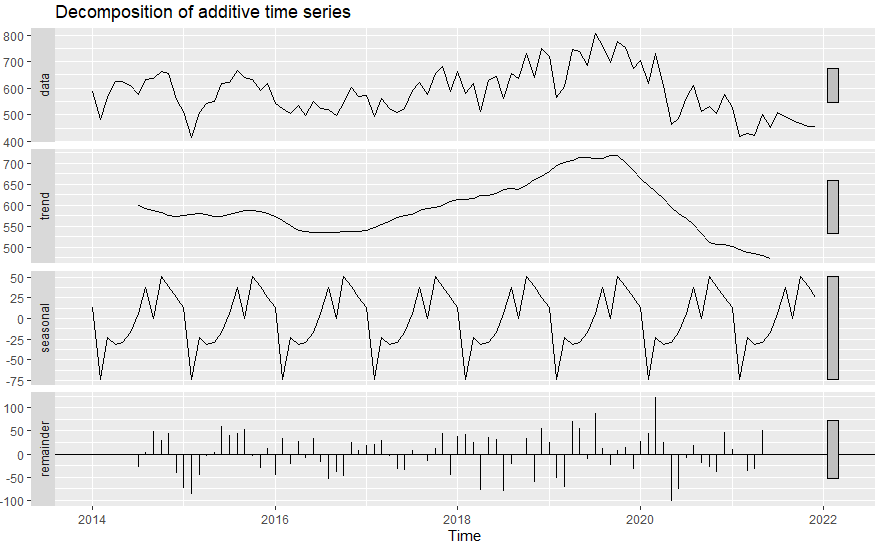
Would there be any seasonality to be interpreted in this plot? I see that February and September may show seasonality but am unsure the best way to interpret this. Link to another question that may provided additional context: Explaining ARIMA forecasts
1 Answer
You might want to include a link to your previous question on this time series. Given the likely impact of an intervention (specifically, the COVID pandemic, and people's response of staying home, and burglars' likely response to that of not breaking and entering so much), I would be very careful about looking for seasonality on the original data. If at all, regress your data on a dummy variable that is 1 since the pandemic starts, then assess seasonality on residuals from that regression.
Your seasonal plot does not really show a lot of signal. Beware of squinting at such plots and convincing yourself that there is something there. Humans are amazingly good at seeing patterns where none exist. This is what a clear seasonal signal looks like.
Per above, I would recommend running auto.arima with external regressors. It is quite good in applying statistical tests to decide whether or not to include seasonality.
-
$\begingroup$ Thanks you again for another insightful answer @stephankolassa. I will have to do a bit more discovery on how to regress my data on a dummy variable like you mentioned. I'm still new to R so some flows are still foreign to me! $\endgroup$ Commented Dec 7, 2022 at 15:41
-
$\begingroup$ You can feed a Boolean time series into the
xregparameter ofauto.arima(). $\endgroup$ Commented Dec 7, 2022 at 15:51


