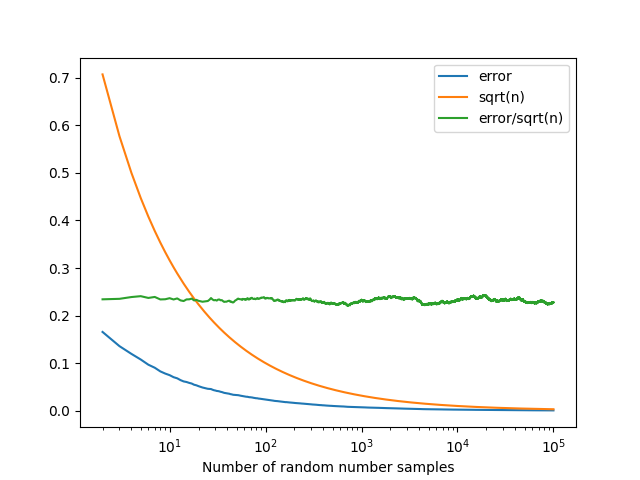
Why √n?
So there is this theory called the central limit theorem that tells us that as sample size increases, sampling distributions of means become normally distributed regardless of the parent distribution. In other words, given a sufficiently large sample size, the mean of all samples from a population will be the same as the population mean. We know that this really happens. Let’s put that in the bank and revisit it later.
Now, let's look at what happens when we have a small sample size (n=5), and then observe what happens if we increase the sample size and leave all the population parameters the same.
population mean: 15
standard deviation: 5
N=5
In the above case, our standard error of the mean (S.E.M.) will be: 5/√5 = 2.236
Now let's consider a case with a sample size of 10
population mean: 15
standard deviation: 5
N=10
S.E.M. will be: 5/√10 = 1.158
Increase the sample to 100: S.E.M = 5/√100 = .5
Increase the sample to 1000: S.E.M = 5/√1000 = .158
...You see the pattern. As sample size increases, the standard error of the mean decreases and will continue to approach zero as your sample size increases infinitely. Why is this? One way to think about it is that if you keep increasing your sample size, you will eventually sample the entire population, at which point, your sample mean is your population mean. That is, any given sample mean will probably not be exactly equal to the true population mean, but as your sample size increases toward the size of the entire population, the amount that a given sample mean is likely to be off by (the standard error) becomes smaller and smaller.
Now, let's go back to the conceptual definition of the standard error of the mean. One way to look at it is as the "standard deviation of sample means", or, alternatively, "On average, a sample of size N will deviate from the population mean by this amount". Therefore, your S.E.M. statistic is giving you an idea of how well your sample mean is likely to approximate the population mean.
So we know that the S.E.M. tells us how well a sample mean of size N approximates the population mean, and we also know that as our sample size increases, any given sample mean will more closely approximate the population mean.
The mathematical expression of those two ideas is the formula for S.E.M.
By dividing by the square root of N, you are paying a “penalty” for using a sample instead of the entire population (sampling allows us to make guesses, or inferences, about a population. The smaller the sample, the less confidence you might have in those inferences; that’s the origin of the “penalty”). That penalty is relatively large when your sample is very small. As the sample size increases, however, that penalty rapidly diminishes, infinitely approaching the point where your sample is equivalent to the population itself.
How fast does a sample mean approach equivalence with the population mean (i.e., how fast does the S.E.M. approach 0) as the sample size increases? That will depend on the numerator in the formula: standard deviation. The standard deviation is a measure of how predictable any given observation is in a population, or how far from the mean any one observation is likely to be. The less predictability, the higher the standard deviation. By the same token, the higher the standard deviation, the less quickly your sample mean will approach the population mean as sample size N increases. The power of the central limit theorem, however, shows us that as sample sizes become very large, the S.E.M. becomes very small, regardless of the standard deviation. That is, having a sufficiently large sample size will lead to a very small S.E.M. in just about all cases. The main differences in this trend between large or small standard deviations appears most notably when sample sizes are small – you pay a large penalty for having a small sample from a population that has a lot of variability!

