0
$\begingroup$

In my problem, I have a condition in which I need to compute the joint distribution of two dependent distributions. The first distribution is normal and the second one is beta distribution. How can I get the joint distribution function of these two distributions? Any help would be appreciated.

Update

Actually, I am testing my hypothesis on the same data using both wilcox and ks tests. (As each of these tests captures one aspect of differences, and I have to detect both.) I need to somehow get one single statistic out of these two statistics (at the moment I am choosing minimum of these two but I know it is not correct). I searched a lot through published literature and found that the wilcox can be approximated using normal distribution and ks using beta distribution. Now, I assume my case is: P(A U B) = P(A)+P(B)-P(A $\cap$ B)

where P(A) refers to probability obtained from normal distribution, P(B) refers to p-value from beta distribution.So what I need is the last part, to make this puzzle completed.

I hope this is clear more. Thanks a lot.

$\endgroup$
4
  • 2
    $\begingroup$ You do not define the dependence between both random variables. (There is no such thing as a joint distribution of distributions, only of random variables.) $\endgroup$
    – Xi'an
    Commented Mar 4, 2023 at 10:00
  • $\begingroup$ @Xi'an I have updated the post to include more specific details. Thanks $\endgroup$
    – Nmgh
    Commented Mar 6, 2023 at 15:48
  • $\begingroup$ I presume by "wilcox' you mean a two sample Wilcoxon-Mann-Whitney test and by "ks" you mean a two sample Kolmogorov-Smirnov test. The new question seems to have literally nothing to do with the original post; neither marginal is what you originally asked about (those are both discrete statistics). A Kolmogorov-Smirnov test will detect the differences that a WIlcoxon-Mann-Whitney test does, just not as efficiently (because its power is spread over a wider class of alternatives). You should explain in detail why you think a Kolmogorov-Smirnov test is insufficient. $\endgroup$
    – Glen_b
    Commented Mar 6, 2023 at 18:27
  • $\begingroup$ To clarify further, the best way to combine those tests depends on the alternatives of interest. You won't be able to figure that out just by looking at their bivariate distribution under H0 (albeit you can calculate that as accurately as you are likely to want under any specific situation via simulation, you need the distribution under alternatives of interest to work out how to get good power) $\endgroup$
    – Glen_b
    Commented Aug 25 at 23:53

1 Answer 1

3
$\begingroup$

I presume your intent is that the marginal distributions are beta and normal respectively, rather than say one conditional and one marginal or both conditional.

Specifying the marginal distributions does not specify the joint distribution.

There's an infinite variety of joint distributions with those marginal distributions, so your question doesn't narrow things down enough to give any single answer. You would need to explain how they are dependent, in some detail. At the very least, to make much progress you'd need to explain what you're trying to achieve (again, in some detail).

Indeed you can unify the specification of dependence structure for any set of continuous marginal distributions by transforming each margin to a uniform, and then looking at the joint distribution of those marginally uniform variates. This is called a copula.

There are many posts on site about copulas. There's also a Wikipedia article on them.

As implied by my earlier comments, there's an infinite variety of copulas. There are many popular families of copulas that might very easily be used.

It might help if you explained more about what sort of joint behavior you want to be able to model. (You refer to "my problem" but say nothing of its nature, which doesn't leave much to go on.)

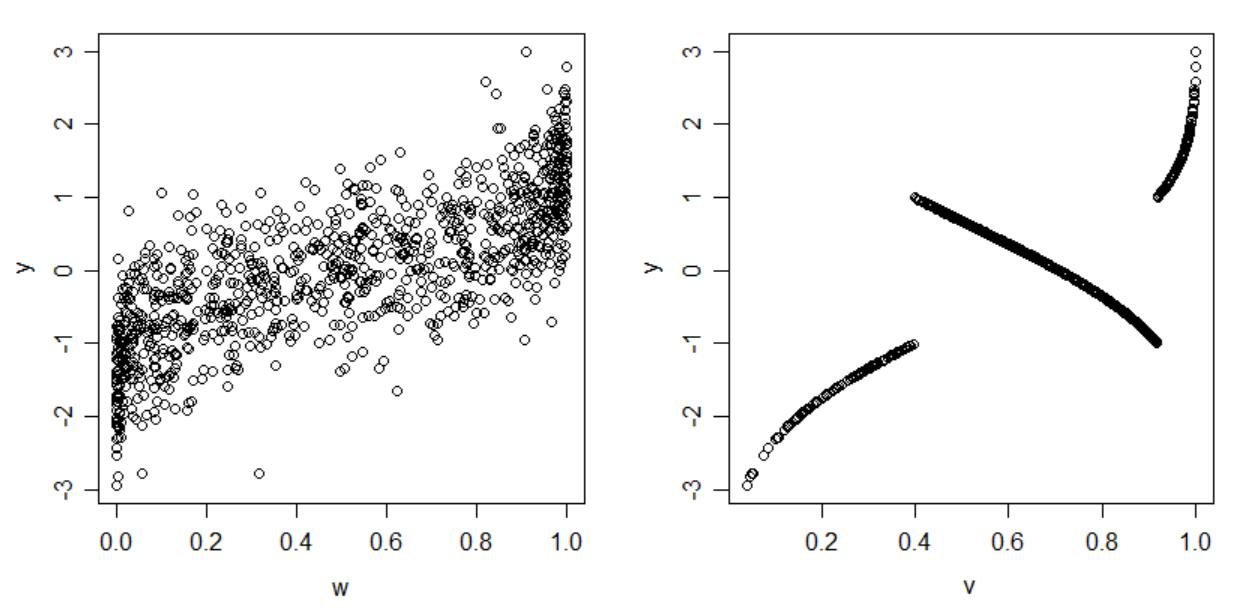
Here's two examples - plots of samples of 1000 pairs of values from joint distributions between a standard normal (Y) and two different betas (W is a beta($\frac12,\frac12$) and V is a beta($2,1$), which is triangular in shape). The two copulas these joint distributions are based off are very different in form, but it's likely that neither of those choices would be useful to your purpose, they're just chosen to illustrate that there's a very wide range of possibilities.

Plots of two joint beta-normal distributions, with different beta margins and different copulas

$\endgroup$
1
  • $\begingroup$ Thanks for your valuable answer. I tried to update my post to include more information. I would appreciate any recommendation. $\endgroup$
    – Nmgh
    Commented Mar 6, 2023 at 15:45

Not the answer you're looking for? Browse other questions tagged or ask your own question.