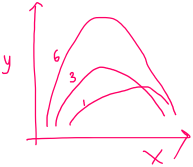
I have a simple dataset where I have fit y = 0 + x + I(x^2) for three altitude levels 1, 3, 6.
I want to test whether the quadratic relationship is different for the three levels.
I can think of two ways of setting it up. But I need help with the interpretation
#1: A simple additive model
lm(y ~ 0 + x + I(x^2) + alt.level)

                   Estimate Std. Error t value Pr(>|t|)
x                 7.684e+00  3.761e+00   2.043   0.0458 *
I(x^2)           -7.292e-04  3.788e-04  -1.925   0.0594 .
alt.level1        4.380e+03  7.350e+03   0.596   0.5537
alt.level3        1.415e+04  6.617e+03   2.138   0.0370 *
alt.level6        3.556e+04  6.617e+03   5.375 1.61e-06 ***


 #2: Interaction of the hump shape with each level
lm(y ~ 0 + x + I(x^2) * alt.level)
                                     Estimate Std. Error t value Pr(>|t|)
x                                   7.769e+00  3.821e+00   2.033   0.0471 *
I(x^2)                             -8.376e-04  4.319e-04  -1.940   0.0578 .
alt.level1                          6.057e+03  8.056e+03   0.752   0.4555
alt.level3                          1.287e+04  7.265e+03   1.772   0.0821 .
alt.level6                          3.545e+04  7.265e+03   4.880 1.01e-05 ***
I(x^2):alt.level3                   1.530e-04  2.551e-04   0.600   0.5513
I(x^2):alt.level6                  1.026e-04  2.551e-04   0.402   0.6892


 #3: Interaction with the quadractic with hump shape
      lm(y ~ 0 + x + I(x^2) * alt.level)
       Coefficients:
                                     Estimate Std. Error t value Pr(>|t|)
    x                               6.763e+00  7.068e+00   0.957  0.34313
    I(x^2)                         -7.375e-04  7.302e-04  -1.010  0.31727
    alt.level1                      6.782e+03  8.872e+03   0.764  0.44816
    alt.level3                      2.081e+04  7.852e+03   2.650  0.01070 *
    alt.level6                      2.696e+04  7.852e+03   3.433  0.00119 **
    x:alt.level3                   -9.593e+00  9.313e+00  -1.030  0.30781
    x:alt.level6                    1.235e+01  9.313e+00   1.326  0.19085
    I(x^2):alt.level3               1.082e-03  9.493e-04   1.140  0.25975
    I(x^2):alt.level6             -1.098e-03  9.493e-04  -1.157  0.25262
I am not sure which is the right model to use for the question: Do the quadratic curves of each level significantly differ from the other? Also, I need some help with the interpretation of the output. For e.g. #3 is only asking if the linear term x alt.elvel1 is different from say the quadratic term of alt.level6 (last line of output). How can I ask if the curve in it's entirety is different between alt1 alt3 and alt6?


xrepresents biologically? I've been fooled by Mother Nature too often to rely on a strict theoretical form in modeling biological data. Sometimes it's better to fit a predictor likexmore flexibly first and then document that the flexible fit is indistinguishable from the expected theoretical form. Knowing more aboutxwould help in making that judgment or suggesting how to proceed with the quadratic modeling as you propose. $\endgroup$