0
$\begingroup$

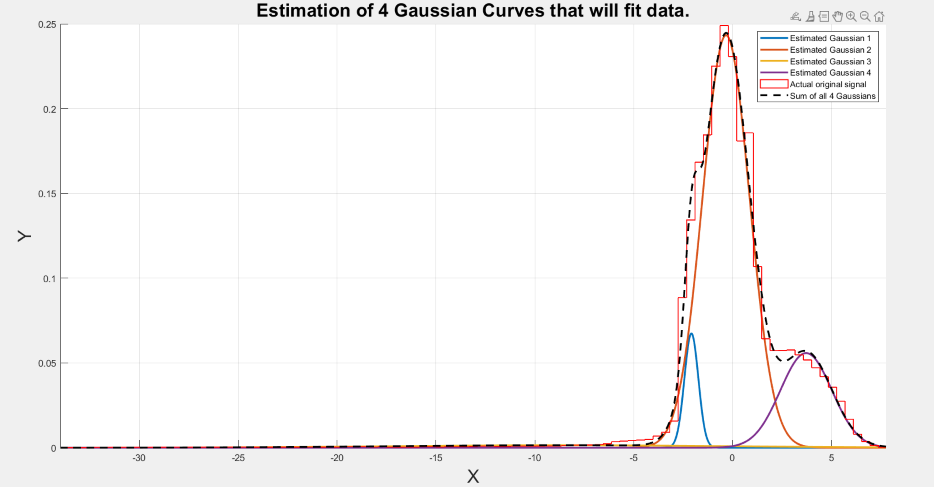
Let Y be a vector of observations. A Gaussian Mixure Model (GMM) is fit to the dataset. The distribution can appear unsymmetrical, with different thickness of tails in both sides. What is the best way to find an optimal estimation for a confidence interval (e.g. $1-\alpha$)?

The goal is to identify the less probable observations. An straightforward solution would be to determine a threshold or a cutoff value for likelihood/probability below which a data point will be considered less probable. However there is no domain knowledge to judge this. I look for a Confidence Interval. I tried to find the bounds by optimizing the problem based on area under the curve. The solution is not the best due to unsymmetry and I assume The optimal CI should be the shortest interval too?! What is the best way to do that?

enter image description here Example of the fitted gaussians and the estimated PDF

$\endgroup$
3
  • $\begingroup$ Since the cdf of a Gaussian mixture is available in closed form, one can derive the shortest interval $(F^{-1}(\beta), F^{-1}(1-\alpha+\beta))$ by moving $\beta$. $\endgroup$
    – Xi'an
    Commented Jul 7, 2023 at 12:50
  • 1
    $\begingroup$ This doesn't read like a confidence interval question, because it lacks a target parameter. Would you perhaps be trying to ask how to find quantiles of a given mixture distribution? If so, you need a numerical procedure, such as implemented in the code at stats.stackexchange.com/a/411671/919. Otherwise, what are you looking for? A tolerance interval, perhaps? $\endgroup$
    – whuber
    Commented Jul 7, 2023 at 14:28
  • $\begingroup$ @wuber , What I look for is not the quantiles but a confidence interval, based on which I can elliminate outliers, assuming a confidence level $\endgroup$
    – Bahar
    Commented Jul 7, 2023 at 15:05

1 Answer 1

0
$\begingroup$

Here it is a solution that you could consider.

First, your goal is to identify the less probable observations, but what do you really mean by less probable? I propose this definition: your goal is to detect a threshold $T$ such that the probability to find any values lower than this threshold is lower or equal than a chosen probability $p$ with $1-\alpha$ confidence level. In math language, if $X$ represents the random variable generated by the distribution shown on your graph, this would be $$ \mathbb{P}(X \leq T) = p. $$

Now, because the pdf of your random variable $X$ is really complicated, it would be difficult to find a mathematical expression for $T$. With what it is called a parametric bootstrap method you could approximate this value. Let us just introduce some notations:

$\theta$ represents the vector that contains the parameter of your mixture of gaussian (namely the different means, standard deviations and weights).

$P_\theta$ represents the distribution of a gaussian mixture with parameter $\theta$.

Here is the algorithm:

Step 1: From your data estimate the parameter $\theta$ and so the distribution $P_\theta$ just as you did already.

Step 2: Suppose that your dataset is of size $n$. By simulation, draw n data from the mixture of gaussian $P_\theta$.

Step 3: order your dataset in increasing order and choose the $p\times n$ lowest value $T_1$.

Step 4: repeat step 2 and 3 B times (typically $B = 1000$) such that you have $B$ different lowest values $T_1, T_2, \cdots ,T_B$.

Step 5: order the data $T_1,T_2,\cdots,T_B$ in increasing order. If you want a $1-\alpha$ lower bound for $T$, then takes the $\alpha B$ smallest value among the $T_i$.

If you want a $1-\alpha$ upper bound then take the $(1-\alpha)B$ lowest value among the $T_i$

If you want a $1-\alpha$ confidence interval then choose as the lower bound the $\alpha B/2$ lowest value and as an upper bound the $(1-\alpha/2)B$ lowest value among the $Ti$.

$\endgroup$
3
  • 1
    $\begingroup$ This approach fails to account for uncertainty in the estimate of $\theta.$ It's also an extremely inefficient (and imprecise) way to compute quantiles of a mixture: see the link I provided in a comment to the question for an optimal method. $\endgroup$
    – whuber
    Commented Jul 7, 2023 at 14:29
  • 1
    $\begingroup$ @lulufofo Thank you fro your answer. I have considered both parametric and non-parametric Bootstrapping. The only accurate way that Bootstrap would work for, would be in case a GMM is fitted to each subsample*. This again reduces the accuracy because fitting the GMM on its own is prone to error, since the underlying function is not known. $\endgroup$
    – Bahar
    Commented Jul 7, 2023 at 15:03
  • $\begingroup$ Ok interesting! Thank you for the comments. $\endgroup$
    – lulufofo
    Commented Jul 8, 2023 at 11:34

Your Answer

By clicking “Post Your Answer”, you agree to our terms of service and acknowledge you have read our privacy policy.