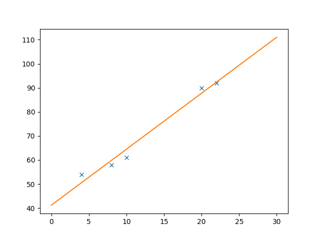
I'm working on a situation (with computations made by someone not involved anymore), where we have a linear regression
and a confidence interval (of shape given in Shape of confidence interval for predicted values in linear regression)
$$y_0 = a + b x_0 \pm t_{1-\alpha/2; n-2} \ S \ \sqrt{\frac{1}{n} + \frac{(x_0 - \bar{x})^2}{\sum_i (x_i - \bar{x})^2}}$$
with $$S = \sqrt{\frac{\sum_i (y_i - \bar{y})^2 - b^2 \sum_i (x_i - \bar{x})^2}{n-2}}$$
and, often, this value is considered:
$$ c = \ S \ \sqrt{\frac{1}{n} + \frac{(\bar{x})^2}{\sum_i (x_i - \bar{x})^2}} $$
How to interpret this value?
It seems to be equal to the distance between the intercept $a$ of the regression line, and the upper prediction band $y_0^+$, except that there is no $t_{1-\alpha/2; n-2}$ involved anymore.
How to interpret this quantity?

