I have panel data for 5 time periods and about 10,000 geographic units. My dependent variable Share is the share of workers in a specific category, and my descriptors represent various factors that have an impact on Share, such as the distance from the rail station, wage level, availability of alternative jobs etc. The OLS regressions for each year have R2 of 0.5 to 0.6 and produce meaningful results, and so does the RE model on the panel. But the R2 of the FE model is negative.
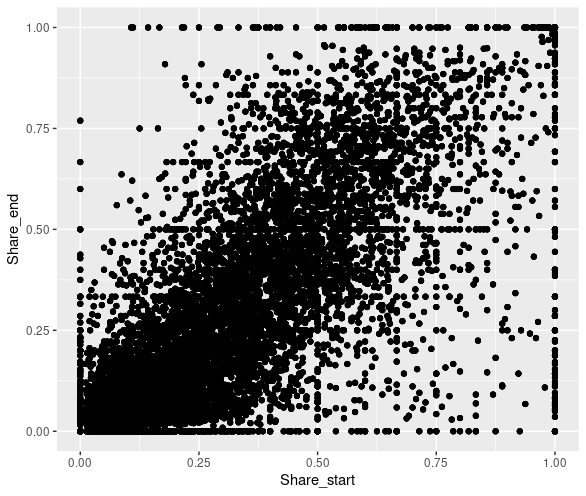
I deal with this issue by dividing my observations into 4 geographic clusters. To do this I produced a chart with the value of Share in Year 1 on one axis and the value of Share in Year 5 on the other. I used a very simple approach: cluster 1 is bottom-left (Share in Y1 < 0.5 & Share in Y5 < 0.5), cluster 2 is bottom-right (Share in Y1 > 0.5 & Share in Y5 < 0.5) etc. In the end, the FE for 2 clusters has R2 ~ 0.5.
My problem may be solved but I have 2 concerns. First, is this approach acceptable? And second, is there a more scientific way to produce borders between clusters than just going from 0 to 0.5 and from 0.5 to 1? I have attached the chart which I have used.

