1
$\begingroup$

I have carried out cluster analysis and now want to compare means between variables in different clusters. The variables in question are age and expenditure in millions of dollars.

The age variable does not follow a normal distribution: as a result, I was considering a Mann-Whitney test. The expenditure in millions of dollars fails the assumption of equality of variances.

Having stated this, although all tests seem to suggest that age does not follow normal distribution, I am not quite sure about the extent of this.
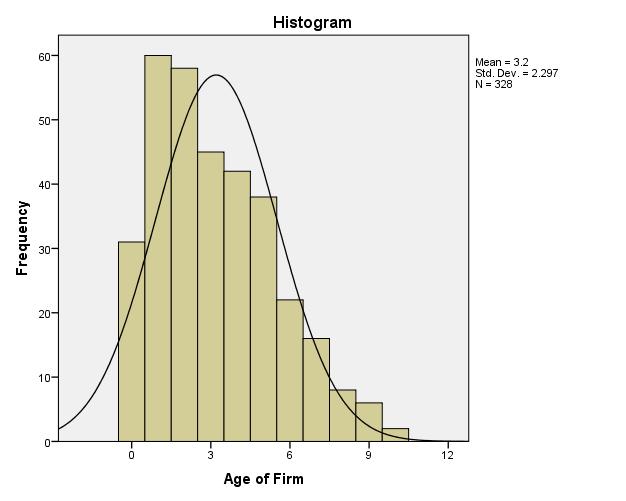
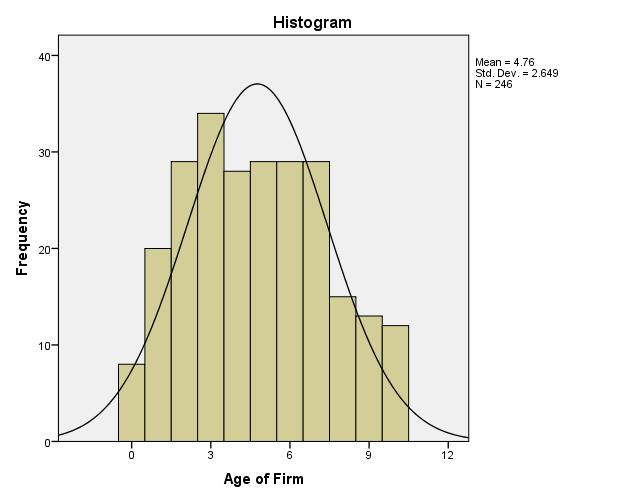
Histogram Age Cluster 1

Histogram of age in cluster 1

Histogram Age Cluster 2

Histogram of Age in Cluster 2

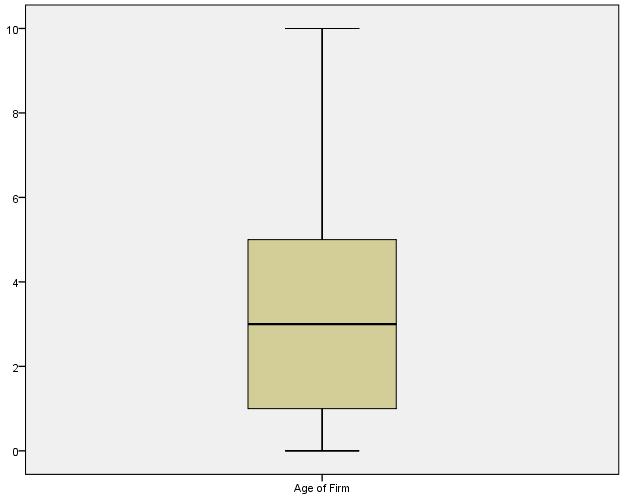
Box plot of age in cluster 1

Box plot of Age in Cluster 1

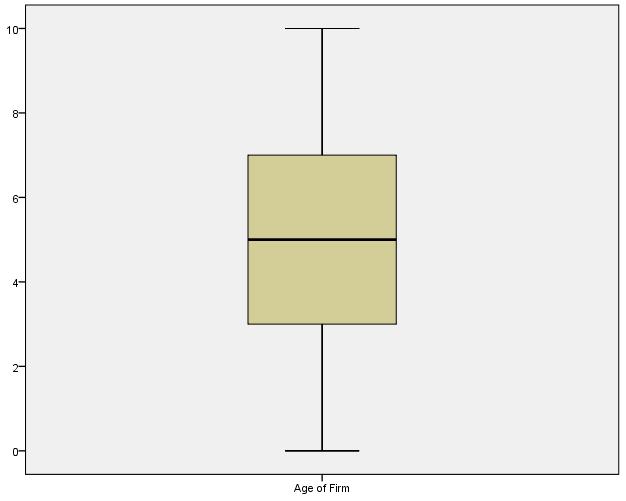
Box Plot - Age - Cluster 2

Box Plot of Age in Cluster 2

It has been suggested to use the Mann-Whitney test in this case, given that the assumption of normality is "not met".

  1. Does Mann Whitney work fine with continuous data? This link seems to suggest it does. Would SPSS automatically convert these into ranks?
  2. Zimmerman argues that t-test should work fine because it is scarcely affected by non-normality of the population!
  3. Sheskin (2007) suggests using a t-test anyway but using a more conservative approach (e.g critical values of t(0.01) instead of t(0.05).

How can I resolve this problem?

$\endgroup$
9

4 Answers 4

7
$\begingroup$

There are many questions on this already, just have a look using the search function. Some details of your questions however seem to warrant some specific remarks:

  • Mann-Whitney U test works fine with continuous data, I would even say it works best with them because you would avoid ties.
  • The t-test has indeed been found robust to some violations of its assumptions but not to all of them, especially if they happen concurrently. Larger sample sizes help to relax these constraints. You can find many information on this elsewhere on this site.
  • Point 3 is surprising. For one, the whole point of a test is to offer some guarantees regarding the error level, provided the assumptions are met. If you can't achieve that, just picking an arbitrary “conservative” level just muddles the situation further. Better give up the test entirely. Furthermore, one common problem with the t-test and non-normal data is lack of power. A lower threshold just makes this problem worse. All this would seem to make the result very difficult to interpret one way or the other.
  • I would generally be skeptical of tests between groups that are not defined a priori, certainly if the variables you are comparing were also used for the cluster analysis. All this sound a bit too exploratory for tests to be meaningful. You might just as well plot the data and comment what you see, understanding that you are just providing a tentative interpretation.

Practical recommendations in light of your comments:

  • Mann-Whitney is perfectly fine but do realize it is not a test of the difference in means. It might or might not be a problem for you but the most important point is that you cannot just think of this problem as “normal data => t-test, non-normal => Mann-Whitney U”. There is a lot more going on (check the links I added as a comment to the question for more on that).
  • The t-test might be fine. I already wrote that a hard-and-fast threshold would be very questionable and it's still impossible to give advice based only on the notion that the data are “non-normal”. Whether it matters or not depends on the specific ways in which they are non-normal.
  • 300 observations is already quite comfortable. Do run both tests, possibly some other alternatives as well (permutation test, bootstrap test of the median or another robust estimator of location if that makes sense…). Also inspect the distribution and the residuals. You might very well find all this point to broadly similar conclusions and would not need to worry about this further.
  • You said that the two variables are not the “main” predictors in the cluster analysis but are they in the analysis at all? I would still not be fully convinced of the value of the whole approach but you should at least keep them entirely separate I think.
  • Don't overestimate tests. Since you are happy using an exploratory method like cluster analysis, do also plot the data and interpret that in any case.
$\endgroup$
12
  • 1
    $\begingroup$ This answer and mine were being written simultaneously. They look entirely consistent to me. $\endgroup$
    – Nick Cox
    Commented Jul 11, 2013 at 10:51
  • 2
    $\begingroup$ @Peter Flom. Glad you agree, but you mean complementary... Insert emoticon if desired. $\endgroup$
    – Nick Cox
    Commented Jul 11, 2013 at 11:02
  • 1
    $\begingroup$ @IdiotAbroad What I mean is that the larger it is, the “nicer” the sampling distribution of the mean even if the distribution of the data is non-normal. It's probably impossible to provide a hard-and-fast threshold which is why you will find a lot of these confusing noncommittal recommendations. $\endgroup$
    – Gala
    Commented Jul 11, 2013 at 11:06
  • 1
    $\begingroup$ Not sure what to make of this last plot. This variable seems in fact discrete but not so bad, considering. Your last edit suggests that by “non-normal”, you mean you rejected normality in some test; I don't think it matters in the least. In any case, what I would look at are density plots, boxplots or stripcharts of each group/cluster, looking for differences in the shape or variance of the distribution. $\endgroup$
    – Gala
    Commented Jul 11, 2013 at 11:46
  • 1
    $\begingroup$ @IdiotAbroad I implicitly suggested you look at them… I can't just make the decision for you, without knowing about the project, over some Internet Q&A site. $\endgroup$
    – Gala
    Commented Jul 11, 2013 at 12:15
4
$\begingroup$

What is the problem that you are trying to solve?

  1. It is the job of cluster analysis to find clusters. Testing whether those clusters really exist post hoc is, in my view, somewhere between meaningless and dubious. To strip the problem down to the bare minimum, imagine one variable that is a continuum, say people's heights, and you group height values into two clusters. Now do you want to test that short people and tall people have different means? Now explain why the problem of three or more clusters and/or two or more variables makes the problem different.

  2. You describe the data as being age and expenditure. If that's so, then a scatter plot showing the data will show clusters clearly if they exist and a continuum of variation if they don't. You can be flexible about scales (e.g. logging expenditure). What cluster analysis might add to this of real scientific value is an open question. Cluster analysis divides statistical people into two clusters, those who think it a central technique and those who think it oversold snake oil or worse.

  3. As with #2, if you are clustering on two variables, then each cluster has two means, mean age and mean expenditure. Even if you have a good answer to #1, univariate tests don't capture the differences between clusters.

  4. If #2 and #3 are wrong, and you have other variables, then the problem is not as you stated and you need to explain why.

  5. If you are interested in means, then Mann-Whitney is not an alternative method of comparing means.

  6. Mann-Whitney uses ranks, so it doesn't even know whether the original data are discrete or continuous. In practice, discrete data are more likely to show ties and that can have a secondary effect on the test. Whether your software adjusts for ties depends on what it is.

  7. How many clusters do you have any way? Is it just two?

I can't advise on SPSS. I often advise against SPSS, but that's a prejudice.

Please give a reference for Sheskin (2007).

$\endgroup$
6
  • $\begingroup$ 1. Having identified the clusters.. I am working further on the results obtained. I am not testing the most important predictors of the cluster analysis. 2. As to the Mann Whitney as not being an alternative in comparing means, I followed Field (2009), in a chapter on comparison of means. He is suggesting using Mann Whitney as an alternative when the normal distribution assumption does not hold. As to your seventh question, yes it is two clusters. $\endgroup$ Commented Jul 11, 2013 at 11:01
  • $\begingroup$ You seem to have thought that I'm clustering on the basis of only these variables, which is not the case. These are the low predictors. $\endgroup$ Commented Jul 11, 2013 at 11:17
  • $\begingroup$ You said nothing about any other variables, although as I stated I did guess that they might exist. I don't know what "low predictors" are, but this information doesn't solve any of the difficulties raised by your question. $\endgroup$
    – Nick Cox
    Commented Jul 11, 2013 at 11:23
  • $\begingroup$ Its unrelated to the question. Let's forget about the clusters for a while. Bascially I have two samples. I want to test whether the mean is different in one sample from the other. $\endgroup$ Commented Jul 11, 2013 at 11:27
  • $\begingroup$ I've now posted a q-norm plot for age. The variation from normal distribution might not be to of concern, but still the normality diagnostic tests fail to suggest a normal distribution $\endgroup$ Commented Jul 11, 2013 at 11:31
3
$\begingroup$

First, realize that the Mann Whitney U test and the t test test different things: The t test is a test of differences in means, the U test is a test of entire distributions. It is possible that the means could be the same and the distributions different (although this would only happen for odd distributions, as far as I can tell, for example

set.seed(12345)
x <- rnorm(1000)
y <- c(rlnorm(500), runif(500,-100,100))
wilcox.test(x,y)
t.test(x,y)

where the Wilcox test rejects at $p = 2.2 * 10^{-16}$ and the t does not reject at all.

Second, while the robustness of the t as a test of means depends on exactly how the data are non-normal, sample size, variances and so on, the fact that it is a test of means remains. If age is not normally distributed you may not want to test the means.

$\endgroup$
10
  • $\begingroup$ The question no post is helping me to establish is the "how non normal". It seems to judgemental to me. $\endgroup$ Commented Jul 11, 2013 at 12:42
  • 1
    $\begingroup$ "judgemental" is probably not the right word for what you want to say. I expect "subjective" comes closer to what you want. $\endgroup$ Commented Jul 11, 2013 at 13:04
  • $\begingroup$ Correct. Subjectivity! $\endgroup$ Commented Jul 11, 2013 at 13:06
  • 2
    $\begingroup$ The circumstances are necessarily more rich than you can describe on an internet forum, so however hard you try it will never be enough for us to make a decision for you. In the end this can only be your decision and your decision alone. $\endgroup$ Commented Jul 11, 2013 at 13:43
  • 2
    $\begingroup$ That is because that answer does not exist in general; it is necessarily a judgement call. In situations like these I like to run simulations. That is a great way to develop an intuition for the problem, and you can use that to get an answer that is tailor made for your data and problem. $\endgroup$ Commented Jul 11, 2013 at 13:52
3
$\begingroup$

The derivation of the Mann Whitney assumes continuous data. When you have heavier-tailed than normal data, it's also typically more powerful than the t-test; if you assume only location shift alternatives, it's a test of difference in means (along with any other reasonable location measure); if that doesn't hold, it's testing something else.

That said, the t-test can tolerate moderate skewness and heavy-tailedness (though in the latter case your actual significance levels will tend to be lower than the nominal $\alpha$).

There's also the possibility of a permutation test rather than either of the choices you mention - it would allow you to test a difference in means and have it be valid when the assumptions of the t-test are not satisfied.

Another possibility if you think that some exponential family distribution might suit better (such as a gamma distribution) would be to fit a GLM with a group factor representing the groups whose means you are comparing. An identity link will even give you a direct estimate of the difference in means.

$\endgroup$
7
  • $\begingroup$ Can you clarify your phrase "if you assume only location shift alternatives" @Glen_b $\endgroup$ Commented Jul 11, 2013 at 16:02
  • $\begingroup$ "t-test can tolerate moderate skewness and heavy-tailedness (though in the latter case your actual significance levels will tend to be lower than the nominal α)", any reference for that and limits for "heavy tailedness" $\endgroup$ Commented Jul 11, 2013 at 16:06
  • $\begingroup$ Consider a null where (possibly combined with the assumptions) two distributions are identical. Consider an alternative where they're identical, except the distribution of one is 'shifted along' by some nonzero amount ($F_X(t) = F_Y(t+\delta)$, where $\delta \neq 0$, say). That alternative describes a location-shift. en.wikipedia.org/wiki/Location_parameter $\endgroup$
    – Glen_b
    Commented Jul 11, 2013 at 16:08
  • $\begingroup$ Is there some test I can run to test if the distributions are identical.. except for this location shift? how can this be determined? $\endgroup$ Commented Jul 11, 2013 at 16:12
  • 1
    $\begingroup$ Well, you could assess the reasonableness of the assumption visually - "does it look like one sample's distribution is a shifted version of the other or doesn't it?" - But if you have no particular reason to think it should be a location shift, you might also question whether a test of location (whether via means or anything else) is particularly meaningful anyway. Which really comes down to asking yourself "what is it I actually want to find out?" $\endgroup$
    – Glen_b
    Commented Jul 12, 2013 at 2:52

Your Answer

By clicking “Post Your Answer”, you agree to our terms of service and acknowledge you have read our privacy policy.

Not the answer you're looking for? Browse other questions tagged or ask your own question.