0
$\begingroup$

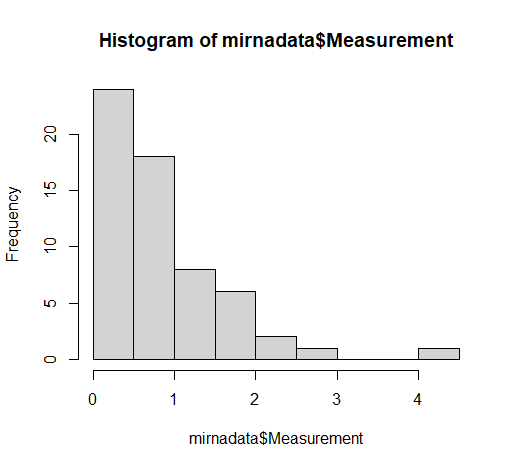
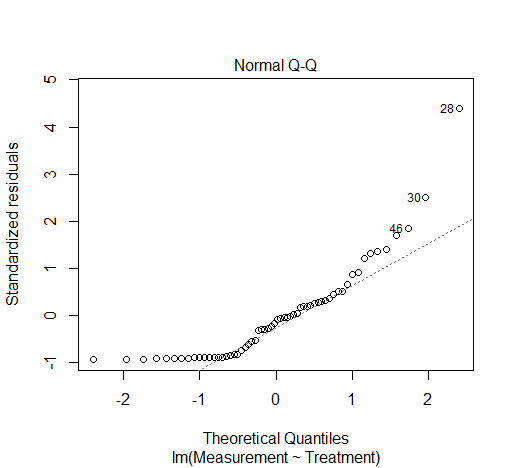
Histogram of data Non-linear distribution of residuals Is there a non-parametric version of a linear mixed model? I've seen some people cite gamm in R as one but unsure of how I would go about using it.

In R, the code I have been using to analyze my data is:

model <- lmer(Measurement ~ Treatment * Time + (1|Family), data=mirnadata)

and this has been working great until I encountered non-parametric data (i.e., residuals are not normally distributed, which is an assumption of the lme). So essentially, I want to do the same analysis on non-parametric data but unsure of how, or even if that's even possible.

The response variable is measurement, which is a continuous variable. Treatment is a categorical variable with 2 levels, and time is a categorical variable with 3 levels. Family is my random effect, and it has 5 levels. This is the code my labmate helped me build and while it works, I don't know if it is correct:

m2 <- gamm(Measurement ~ Treatment * Time, random=list(Family=~1),data=mirnadata)
summary(m2$lme)
$\endgroup$
4
  • 1
    $\begingroup$ Hi Kiara! What do you mean by "encountered non-parametric data"? $\endgroup$
    – Stefan
    Commented Apr 5 at 0:01
  • $\begingroup$ Hi Stefan, the residuals are not normally distributed, which is one of the assumptions of the lme. $\endgroup$
    – Kiara H
    Commented Apr 5 at 0:10
  • 1
    $\begingroup$ Can you post your residual plot and a histogram of your data? Or provide some sample data that represents what you are measuring? $\endgroup$
    – Stefan
    Commented Apr 5 at 2:28
  • $\begingroup$ Hi Stefan, I have uploaded both - it is clear that the distribution of the residuals is non-linear. I have tried transformations (log, box-cox, sqrt) to try to make it normal and linear, but this has not worked out. As such, I am exploring GAMMs and would love some help with the code! $\endgroup$
    – Kiara H
    Commented Apr 8 at 15:26

1 Answer 1

2
$\begingroup$

I think there is some confusion on the terms and the programming elements, so let me explain a bit what each is:

  • A linear mixed model (LMM) is a linear regression technique that incorporates random effects along with the typical fixed effects. As you already noted, the residuals are assumed to be normally distributed, though they don't have to be exactly normal to work. There are different functions in R which estimate this, including lme and lme4.
  • A generalized linear model (GLM) is a regression which, unlike ordinary least squares (OLS), allows one to specify exponential families (logistic, Poisson) etc. to deal with residuals that on paper shouldn't act normal. If for example we have binary data, it is very common to model this with a logistic GLM with a function like glm in R. Generalized linear mixed models (GLMMs) are just the random effects equivalent, and are fit with functions like glmmTMB or glmer rather than lmer or lme.
  • Generalized additive models (GAMs) are simply GLMs that can more flexibly handle nonlinear data. If we are modeling a bivariate relationship which resembles something complex like a cosine function that can't be easily fit as such, then a GAM can be useful for finding the "true" function. Generalized additive mixed models (GAMMs) are GAMs with random effects. Both can be fit with the gam function, but the gamm4 function uses a lme4 style random effects specification, which can at times be more efficient and provide more flexibility with random effects.

Based off what you have noted here, it appears that the sole consideration you are thinking about is the residual patterns. So there are two things that you should think about to answer your question.

  • What does the residual pattern look like? If the histogram/density plot of the residuals is not bell-shaped, you need to figure out why. For example, if you plot the fitted values against the residuals and find that the residuals "fan out" with increases in fitted values, this can be a sign of variance heterogeneity, and can be modeled with methods like location-scale models to deal with this. If this plot shows a very defined curve, then this is a sign of nonlinearity and is better modeled with a GAMM.
  • Are there data-driven ways that your residuals look this way? Consider counts with a very limited range. They can only be positive and are often right-skewed. Modeling this with a LMM would be limited, but using a Poisson or negative binomial GLMM would potentially work better.

It may help to edit your question to include more details about the residuals, where a more precise answer can be given. I have at least covered some conceptual issues and potential avenues, but a better answer may come with better info in your question.

On a final note, the gamm specification isn't really doing anything necessarily "better" than the lmer fit. The GAMM you have specified assumes a Gaussian distribution of residuals and and has only linear terms. I would only assume you would want to use a GAMM if you are fitting something like splines (e.g. thin plate regression splines for nonlinear data).

$\endgroup$
6
  • $\begingroup$ Hi Shawn, thanks so much for your answer! $\endgroup$
    – Kiara H
    Commented Apr 5 at 0:57
  • $\begingroup$ To your points about the data-driven nature of the skewness, I know why it looks like that. Essentially, I am comparing the expression of a gene that is upregulated by heat in bacteria at three time points: baseline, heat, and recovery, and as such it is quite high in the heat group and low in the other two time points, so the data points are either very low or high, making the histogram right skewed as you said. What data about the residuals can I include to shed more light on the issue? Apologies, I know very little about statistics. $\endgroup$
    – Kiara H
    Commented Apr 5 at 1:08
  • $\begingroup$ I checked the plot of the residuals vs the fitted valus and I see that there is no such heteroscedasticity issue (I also tested that statistically). I believe a GAMM is the best way to go in this case, I'm just unsure of how it should be coded. $\endgroup$
    – Kiara H
    Commented Apr 5 at 1:50
  • $\begingroup$ It may be helpful to edit your question to include these residual checks. Is heat your DV? I'm assuming then that it takes on a non-negative response. I've also edited my answer to include some clarification about the syntax you have provided. $\endgroup$ Commented Apr 5 at 2:29
  • $\begingroup$ Thanks, I conducted a Breusch-Pagan test and the p value was 0.58. I have also updated the question to include the Histogram and residual plot of the data. So, I have one response variable (Measurement), and two fixed effects (Treatment and Time, Time includes the heat factor) and one random effect which is family. I'm looking for some help with the GAMM code if possible. $\endgroup$
    – Kiara H
    Commented Apr 8 at 15:30

Your Answer

By clicking “Post Your Answer”, you agree to our terms of service and acknowledge you have read our privacy policy.

Not the answer you're looking for? Browse other questions tagged or ask your own question.