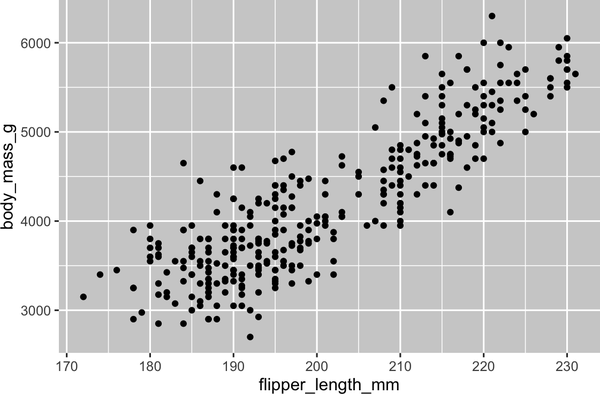
If I have continuous x and y variables I can fit a simple regression. But I want to know how can I test if the lower and upper values of my variables are associated with different groups as in the figure here even if there's no difference in slope or intercept. Here it looks like there's a group that I could box off at x < 200 & y < 5000.
Adding a grouping factor, y ~ x + group, doesn't seem to work because that assesses a difference in intercept.

