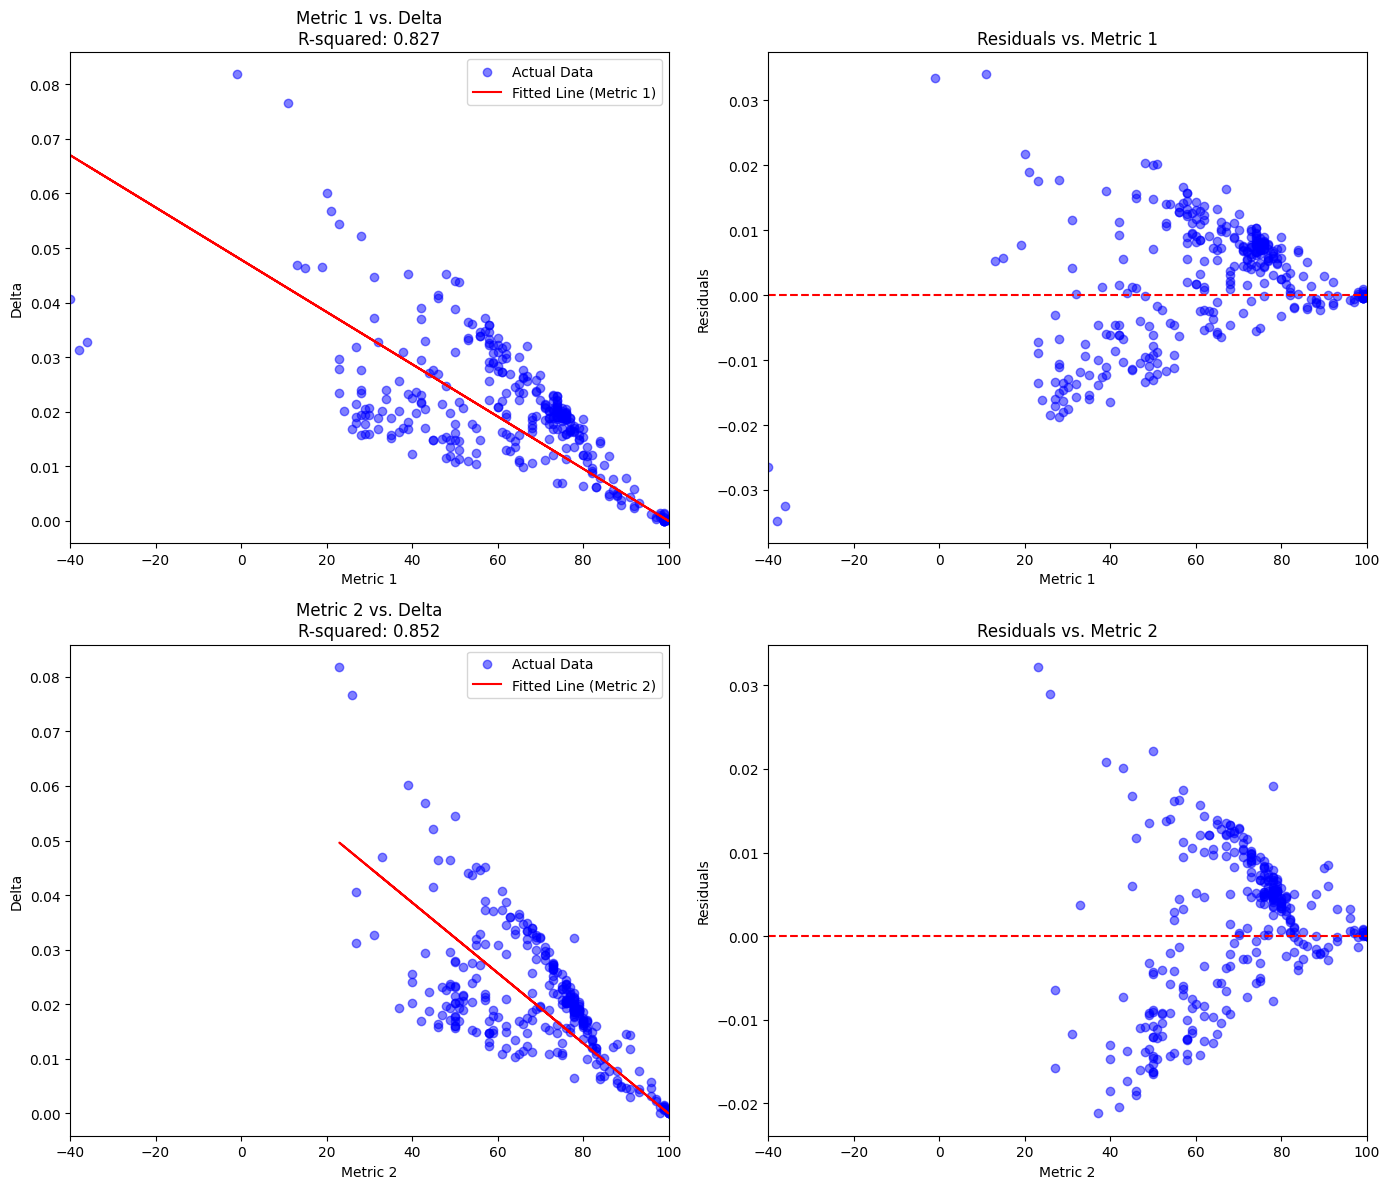
I'm trying to compare two test metrics (Metric A and Metric B) to determine which one better predicts a delta value, which represents a Euclidean difference. I am unsure how to determining which metric is better at predicting the delta and how to statistically validate this difference. Here's the relevant details and my approach so far. Any suggestions would be greatly appreciated.
Metrics and Delta Values:
- Metrics Range: Both metrics nominally range from 0 to 100, but one metric can produce negative values.
- Delta Values: Always equal to or greater than 0.
- Special Condition: When either metric equals 100, the delta will be 0.
Current Approach:
Correlation Analysis:
- I performed a correlation analysis between Metric A and Metric B, and they correlate highly with each other. (~0.95)
Linear Regression:
- I have performed linear regressions between Metric A and Delta, and Metric B and Delta.
- I compared the R² values from these regressions to evaluate predictive power.
Heteroscedasticity Issue:
- The residual plots from the regressions show a high degree of heteroscedasticity. This seems like a big concern. I'm wondering how to deal with this.
- I think the heteroscedasticity is expected because, as the metric values decrease, the deltas tend to become greater.
Objective:
- Primary Goal: Determine which metric (Metric A or Metric B) better predicts the delta value.
- Statistical Significance: Check if the difference in predictive power between the two metrics is statistically significant.
Proposed Solution:
- Likelihood Ratio Test:
- I have read that calculating the Likelihood Ratio Test Statistic and its p-value could be useful for this comparison.
- This approach might help in determining the statistical significance of the differences in predictive power.
Likelihood Ratio Test Statistic: 50.555228536421964
P-value: 1.1585811876258776e-12

