9
$\begingroup$

I have an $x$ and a $y$ that I would like to find the correlation of to learn more about their relationship. Unfortunately, I only have $10$ points. Can I in good faith use the Pearson correlation coefficient (are there generally accepted rules for when to not use it in the case of dataset size)? Is there some sort of alternative correlation that is recommended for a situation like this?

If it's relevant, I actually have lots of $x$s and $y$s with $10$ points each, and I'm using the correlation coefficient to summarize what I see. Visual inspection by graph shows a lot of mixed results (a couple look somewhat linear and give a Pearson correlation coefficient around $0.8$, but most have odd non-linear relationships).

$\endgroup$
2
  • 2
    $\begingroup$ Why not just show (some of) your data? The question isn't just one of principle; it's one of what is good or not so good for your data. $\endgroup$
    – Nick Cox
    Commented Jun 29 at 10:37
  • 2
    $\begingroup$ I second the request by @NickCox. Particularly I wonder whether "odd non-linear relationships" are indeed clearly (and potentially meaningfully) nonlinear, or whether random variation could make you think that something that doesn't look clearly linear is "oddly nonlinear" despite the fact that 10 observations are really not many to nail down meaningful nonlinearity with confidence. $\endgroup$ Commented Jun 29 at 12:11

5 Answers 5

9
$\begingroup$

Estimators based on sample statistics are not very reliable indicators of the population quantities they estimate when sample sizes are very small.

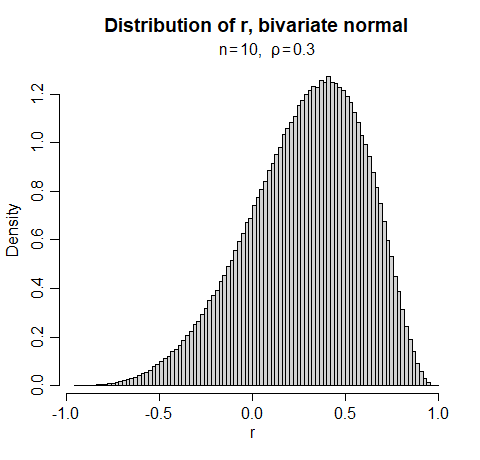
In short, the sample correlation $r$ could be very far from the population correlation $\rho$. For example, when sampling from a bivariate normal distribution with a population correlation of $0.3$, you could quite easily see a sample correlation below $-0.2$ or above $0.7$ (in total, this would happen about 15% of the time at $n=10$).

Histogram of one million sample correlations from a bivariate normal with rho = 0.3. It's a broad, left-skewed distribution, with close to 7.5% of values both below -0.2 and above 0.7

You can still perform inference, of course, but estimates will have large standard errors, confidence intervals will be wide and tests will have low power.

While I don't think you can generally rely on the visual impression of the shape of a relationship from very small samples (humans are great at seeing pattern in random variation), if you really do have nonlinear relationships, then the extent to which a linear correlation is telling you much about the real relationship will be quite limited.

Is there some sort of alternative correlation that is recommended for a situation like this?

There are other ways to measure correlation but they won't make up for high standard errors due to small sample sizes.

$\endgroup$
7
$\begingroup$

In line with the answer @Glen_b in the worst case (true correlation is zero) you need 300-400 observations to well-estimate $r$, e.g., to within a margin of error of 0.1 with 0.95 compatibility. For very small samples a reviewer would get a non-misleading impression of the results if the analyst provided a compatibility interval (aka confidence interval) for $r$ and hid the point estimate.

The only way for a small sample size to provide an adequately precise $r$ is for the true $r$ to be somewhat close to 1 or -1. That is when the margin of error gets closer to 0.1, for example. This may be useful for experimental design purposes but for just analyzing the data at hand, the usual Fisher $z$-transform-based confidence interval is often the best we can do.

I recommend Spearman’s $\rho$ as a default correlation index so as to not assume linearity. The $z$-transform confidence interval works approximately OK for this index also.

More details are here where you can also see sample sizes needed to get the right sign on $r$ to a high probability.

$\endgroup$
5
$\begingroup$

I agree with all of Glen_b's points.

What could you try?

First, is there any substantively sensible way to combine some of the sets of 10? That is, not a method based on statistics, but on what you know about x, y, and the samples?

Second, I would look at scatterplot matrices. Also a matrix of quantile quantile plots. With only 10 points each, there is great risk of seeing things that aren't necessarily there (as Glen notes) but you might also see something that actually is there.

$\endgroup$
4
$\begingroup$

I'm somewhat more positive than the other two answers, but it all depends on (a) how your data actually look like and (b) what you will then do with the correlations, and whether there are good alternatives for doing this.

In any case I think that the sample correlation coefficient can be used as a descriptive statistic formalising the tendency in the data to show to what extent large values in $x$ tend to go together with large values in $y$ without the ambition of estimating any assumed underlying truth at high accuracy. As such it doesn't look wrong to me to use it to "summarize what I see" as you put it. Of course if you summarise your data in this way, you focus on a certain aspect and lose other aspects of your data, and you should ask what you lose and to what extent this would be relevant to your aims. Also it'd need a justification to represent any of these datasets by a single statistic in a later analysis, but I can well imagine situations in which this makes sense. Also it depends to some extent on your data (outliers are bad for Pearson correlation, and if you have some clear nonlinear patterns, these may not be well reflected either).

The other answers are correct stating that sample correlation on 10 data points isn't very precise estimating a "true underlying" correlation value, but I don't necessarily think that this would be required for "summarising" the data with potential use of the summaries in another analysis at higher level.

PS:

(are there generally accepted rules for when to not use it in the case of dataset size)

Actually there are much fewer "generally accepted rules" in statistics than many non-statisticians seem to think. A lot of things can make sense in certain situations and not in others, and often without knowing the meaning of the data and the aim of analysis we wouldn't want to tell.

$\endgroup$
2
$\begingroup$

I would give the results in terms of two-tailed p-value (that is, if a sample has a correlation of $r_s$, give $P(|r|\ge r_s)$ under the null hypothesis that the true correlation is 0). This gives the same information as correlation (other than needing to give direction as an additional piece of information), but is more salient.

$\endgroup$

Your Answer

By clicking “Post Your Answer”, you agree to our terms of service and acknowledge you have read our privacy policy.

Not the answer you're looking for? Browse other questions tagged or ask your own question.