I am going to propose an alternative to the ordered probit/logit approach that I have not seen used before. If this turns out to be a stupid idea, someone will surely point that out and we will all learn something.
The main idea is to divide the star rating by the max value of five, so that it lies in [0,1]. This leaves zero stars at zero and maps a perfect five-star business to one. This means you can use a fractional probit or logit on the rescaled outcome, get predictions and marginal effects, and then scale them back up to the familiar five-star scale. This model is computationally less demanding and suitable if you care merely about the change in the average rating.
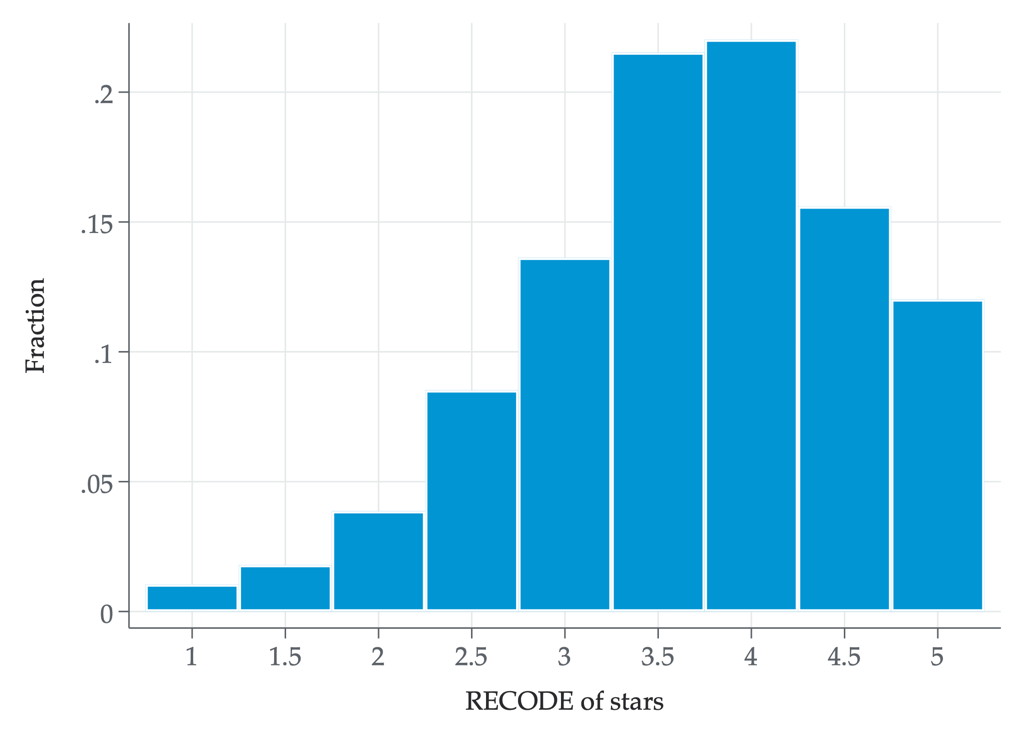
Here's a toy example in Stata on some business ratings from Yelp. The distribution of ratings looks like this:
 I will model the star rating as a function of a quadratic polynomial in latitude. I will consider the change in the average rating associated with moving 25 degrees further north. The effect from the fractional probit model is almost 1/3 of a star, and tightly estimated:
. clear

. // (1) Get Yelp Ratings Data
. copy "https://raw.githubusercontent.com/katazmic/yelpAnalytics/90534078aa062267a254d6c52285b54d97109385/yelp_academic_dataset_business.csv" yelp_businesses_raw.csv, replace

. // (2) Clean Up Variable Names To Be Palatable to Stata
. ! head -n 1 yelp_businesses_raw.csv | sed 's/\./_/g' | sed 's/ /_/g' | sed 's/,/ /g' | tr '[:upper:]' '[:lower:]' > varnames.csv


. import delimited varnames using "varnames.csv", clear case(lower) varnames(nonames)
(encoding automatically selected: ISO-8859-1)
(1 var, 1 obs)

. local oldvarnames = varnames[1]

. local oldvarnames = subinstr("`oldvarnames'", "attributes_good_for_kids", "attributes_good_for_kids1",1)

. local oldvarnames = subinstr("`oldvarnames'", "attributes_good_for_kids", "attributes_good_for_kids2",1)

. local oldvarnames = subinstr("`oldvarnames'", "attributes_", "attr_",.)

. local oldvarnames = subinstr("`oldvarnames'", "attr_dietary_restrictions_", "attr_diet_",.)

. local oldvarnames = subinstr("`oldvarnames'", "attr_hair_types_specialized_in_", "attr_hair_spec_in_",.)

. local newvarnames ""

. foreach var of local oldvarnames {
  2.     local newvarnames `"`newvarnames' `=lower(strtoname("`var'"))'"'
  3. }

. // (4) Import the Data and Rename With Clean Variables Names
. import delimited using yelp_businesses_raw.csv, clear delim(",") rowrange(2) varnames(nonames) bindquote(strict) case(lower)
(encoding automatically selected: ISO-8859-1)
(105 vars, 61,184 obs)

. rename (v*) (`newvarnames')

. // (5) Fractional Probit Model with Star Rating Rescaled to Lie in [0,1]
. gen stars_norm = stars/5

. assert inrange(stars_norm, 0, 1)

. fracreg probit stars_norm c.latitude##c.latitude, vce(robust) nolog


Fractional probit regression                            Number of obs = 61,184
                                                        Wald chi2(2)  = 122.72
                                                        Prob > chi2   = 0.0000
Log pseudolikelihood = -35392.619                       Pseudo R2     = 0.0002

---------------------------------------------------------------------------------------
                      |               Robust
           stars_norm | Coefficient  std. err.      z    P>|z|     [95% conf. interval]
----------------------+----------------------------------------------------------------
             latitude |  -.0273943   .0044782    -6.12   0.000    -.0361714   -.0186172
                      |
c.latitude#c.latitude |   .0003479   .0000513     6.79   0.000     .0002474    .0004484
                      |
                _cons |   1.153459    .094506    12.21   0.000     .9682306    1.338687
---------------------------------------------------------------------------------------

. // predict rescaled star rating at current latitude and at 25 degrees further north
. margins, at((asobserved) latitude) at(latitude = generate(latitude + 25)) post // coefl

Predictive margins                                      Number of obs = 61,184
Model VCE: Robust

Expression: Conditional mean of stars_norm, predict()
1._at: (asobserved)
2._at: latitude = latitude + 25

------------------------------------------------------------------------------
             |            Delta-method
             |     Margin   std. err.      z    P>|z|     [95% conf. interval]
-------------+----------------------------------------------------------------
         _at |
          1  |   .7346609   .0007201  1020.17   0.000     .7332495    .7360724
          2  |   .7891537    .004838   163.11   0.000     .7796714    .7986361
------------------------------------------------------------------------------

. // Calculate Finite Difference and Transform Back to Original Scale
. lincom 5*(_b[2._at] - _b[1._at]) // Effect is ~1/3 stars

 ( 1)  - 5*1bn._at + 5*2._at = 0

------------------------------------------------------------------------------
             | Coefficient  Std. err.      z    P>|z|     [95% conf. interval]
-------------+----------------------------------------------------------------
         (1) |    .272464    .024192    11.26   0.000     .2250484    .3198795
------------------------------------------------------------------------------
For comparison, here's what the ordered probit model would look like (with fewer categories):
. // (6) Ordered Probit Model with Star Rating Categories
. recode stars (1 = "1") (1.5 = 2 "1.5") (2 = 3 "2") (2.5 = 4 "2.5") (3 = 5 "3") (3.5 = 6 "3.5") (4 = 7 "4") (4.5 = 8 "4.5") (5 = 9 "5"), gen(star_cat)
(60,547 differences between stars and star_cat)

. oprobit star_cat c.latitude##c.latitude, nolog

Ordered probit regression                               Number of obs = 61,184
                                                        LR chi2(2)    =  52.78
                                                        Prob > chi2   = 0.0000
Log likelihood = -118357.1                              Pseudo R2     = 0.0002

---------------------------------------------------------------------------------------
             star_cat | Coefficient  Std. err.      z    P>|z|     [95% conf. interval]
----------------------+----------------------------------------------------------------
             latitude |  -.0571126   .0091394    -6.25   0.000    -.0750256   -.0391996
                      |
c.latitude#c.latitude |   .0006907   .0001059     6.52   0.000     .0004831    .0008983
----------------------+----------------------------------------------------------------
                /cut1 |  -3.459527    .191486                     -3.834833   -3.084221
                /cut2 |  -3.054382   .1912211                     -3.429169   -2.679596
                /cut3 |  -2.646753   .1911211                     -3.021343   -2.272162
                /cut4 |  -2.174837   .1910784                     -2.549344    -1.80033
                /cut5 |   -1.70519   .1910467                     -2.079635   -1.330745
                /cut6 |   -1.13739   .1910135                     -1.511769   -.7630103
                /cut7 |  -.5518906   .1909904                     -.9262248   -.1775564
                /cut8 |    .027655   .1909572                     -.3466143    .4019243
---------------------------------------------------------------------------------------

. // Get Pr(Category = j | Latitude)
. margins, at(latitude = generate(latitude)) at(latitude = generate(latitude + 25))

Adjusted predictions                                    Number of obs = 61,184
Model VCE: OIM

1._predict: Pr(star_cat==1), predict(pr outcome(1))
2._predict: Pr(star_cat==2), predict(pr outcome(2))
3._predict: Pr(star_cat==3), predict(pr outcome(3))
4._predict: Pr(star_cat==4), predict(pr outcome(4))
5._predict: Pr(star_cat==5), predict(pr outcome(5))
6._predict: Pr(star_cat==6), predict(pr outcome(6))
7._predict: Pr(star_cat==7), predict(pr outcome(7))
8._predict: Pr(star_cat==8), predict(pr outcome(8))
9._predict: Pr(star_cat==9), predict(pr outcome(9))

1._at: latitude =      latitude
2._at: latitude = latitude + 25

------------------------------------------------------------------------------
             |            Delta-method
             |     Margin   std. err.      z    P>|z|     [95% conf. interval]
-------------+----------------------------------------------------------------
_predict#_at |
        1 1  |   .0103948   .0004099    25.36   0.000     .0095914    .0111983
        1 2  |   .0051554   .0005129    10.05   0.000     .0041502    .0061606
        2 1  |   .0178784   .0005355    33.38   0.000     .0168288     .018928
        2 2  |   .0100725   .0008187    12.30   0.000     .0084678    .0116772
        3 1  |   .0386198   .0007789    49.59   0.000     .0370933    .0401464
        3 2  |   .0238898   .0016102    14.84   0.000     .0207339    .0270458
        4 1  |   .0851714   .0011285    75.47   0.000     .0829595    .0873833
        4 2  |     .05853   .0031334    18.68   0.000     .0523887    .0646713
        5 1  |   .1362984   .0013876    98.23   0.000     .1335788    .1390179
        5 2  |   .1049775   .0041789    25.12   0.000     .0967871    .1131679
        6 1  |   .2153778   .0016624   129.56   0.000     .2121195     .218636
        6 2  |   .1893193   .0045789    41.35   0.000     .1803449    .1982938
        7 1  |   .2202074   .0016752   131.45   0.000      .216924    .2234907
        7 2  |   .2256132   .0020153   111.95   0.000     .2216632    .2295632
        8 1  |   .1558315   .0014666   106.26   0.000      .152957    .1587059
        8 2  |   .1886484   .0036141    52.20   0.000      .181565    .1957318
        9 1  |   .1202205   .0013143    91.47   0.000     .1176446    .1227965
        9 2  |   .1937938   .0120642    16.06   0.000     .1701484    .2174392
------------------------------------------------------------------------------

. // Calculate Finite Differences For Each Star Rating Category
. margins, at(latitude = generate(latitude)) at(latitude = generate(latitude + 25)) contrast(atcontrast(ar._at)) post

Contrasts of adjusted predictions                       Number of obs = 61,184
Model VCE: OIM

1._predict: Pr(star_cat==1), predict(pr outcome(1))
2._predict: Pr(star_cat==2), predict(pr outcome(2))
3._predict: Pr(star_cat==3), predict(pr outcome(3))
4._predict: Pr(star_cat==4), predict(pr outcome(4))
5._predict: Pr(star_cat==5), predict(pr outcome(5))
6._predict: Pr(star_cat==6), predict(pr outcome(6))
7._predict: Pr(star_cat==7), predict(pr outcome(7))
8._predict: Pr(star_cat==8), predict(pr outcome(8))
9._predict: Pr(star_cat==9), predict(pr outcome(9))

1._at: latitude =      latitude
2._at: latitude = latitude + 25

------------------------------------------------
             |         df        chi2     P>chi2
-------------+----------------------------------
_at@_predict |
 (2 vs 1) 1  |          1      109.03     0.0000
 (2 vs 1) 2  |          1       98.02     0.0000
 (2 vs 1) 3  |          1       89.54     0.0000
 (2 vs 1) 4  |          1       76.41     0.0000
 (2 vs 1) 5  |          1       59.89     0.0000
 (2 vs 1) 6  |          1       36.12     0.0000
 (2 vs 1) 7  |          1       24.35     0.0000
 (2 vs 1) 8  |          1      103.12     0.0000
 (2 vs 1) 9  |          1       38.05     0.0000
      Joint  |          8      766.12     0.0000
------------------------------------------------

--------------------------------------------------------------
             |            Delta-method
             |   Contrast   std. err.     [95% conf. interval]
-------------+------------------------------------------------
_at@_predict |
 (2 vs 1) 1  |  -.0052394   .0005018     -.0062229    -.004256
 (2 vs 1) 2  |  -.0078058   .0007884     -.0093511   -.0062606
 (2 vs 1) 3  |    -.01473   .0015567     -.0177811    -.011679
 (2 vs 1) 4  |  -.0266414   .0030477     -.0326148    -.020668
 (2 vs 1) 5  |  -.0313209   .0040472     -.0392532   -.0233885
 (2 vs 1) 6  |  -.0260584    .004336     -.0345568   -.0175601
 (2 vs 1) 7  |   .0054058   .0010954      .0032588    .0075528
 (2 vs 1) 8  |    .032817   .0032316       .026483    .0391509
 (2 vs 1) 9  |   .0735733   .0119267      .0501974    .0969491
--------------------------------------------------------------

. marginsplot, yline(0) xlab(1 "1" 2 "1.5" 3 "2" 4 "2.5" 5 "3" 6 "3.5" 7 "4" 8 "4.5" 9 "5") ylab(#10) ///
> title("Effect of Relocating 25 Degrees North on Each Star Ratings") ytitle("Change in Probability")

Variables that uniquely identify margins: _outcome
Multiple at() options specified:
      _atoption=1: latitude = generate(latitude)
      _atoption=2: latitude = generate(latitude + 25)

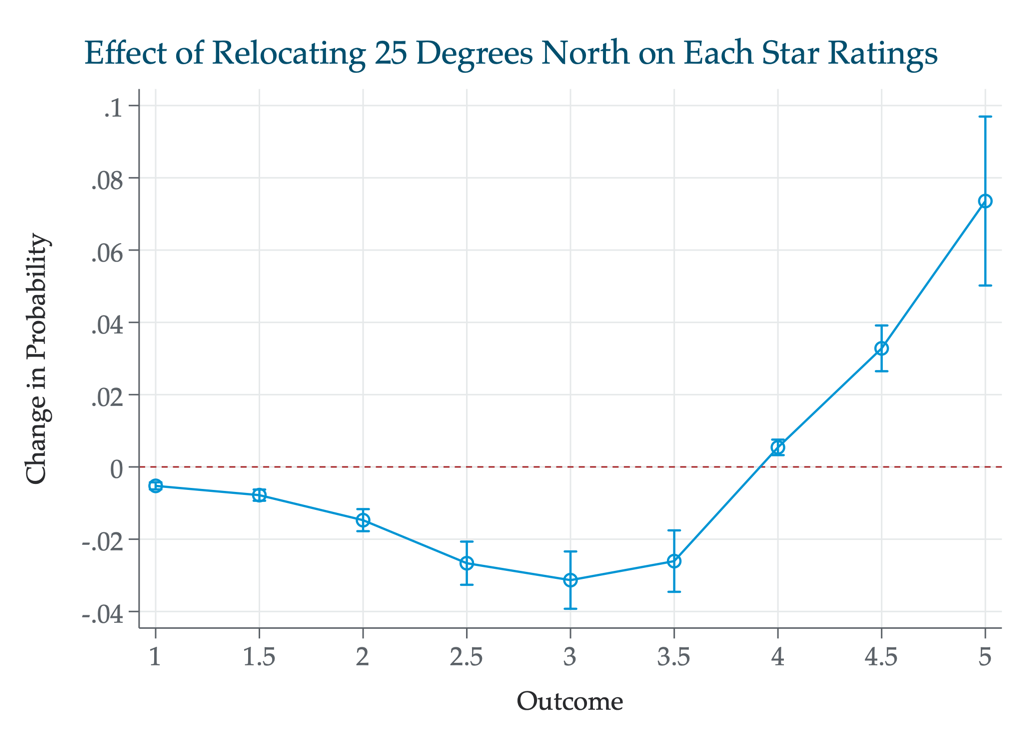
This shows that ratings in the left part of the star distribution become less probable, especially in the middle, while top ratings become more likely.
This took a bit longer to run since there are multiple effects, but it offers a richer picture of what's happening in all parts of the distribution.


