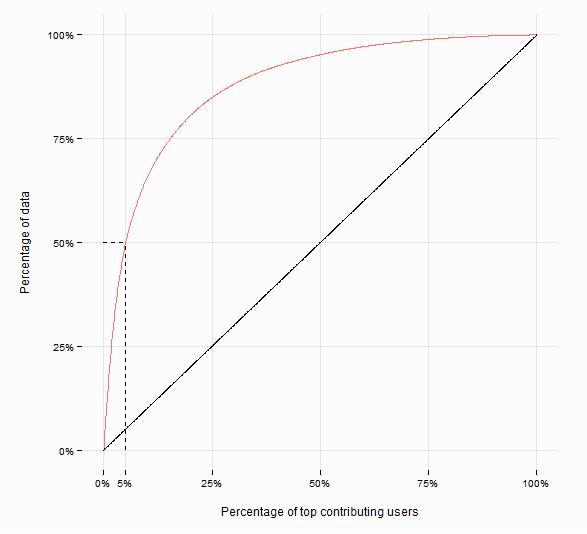
I found a way to quickly visualize the Lorenz curve with ggplot2, resulting in a more aesthetic and easier-to-interpret graphic. For this latter reason, I mirrored the Lorenz curve on the diagonal line which results in a more intuitive form, if you ask me. It also contains annotation lines that should facilitate the explanation of the plot (e.g. "The 5% top contributing users make up 50% of the data"). Attention: Finding the right spot for the annotation line makes use of a quite idiotic heuristic and might not work with a smaller data set.
Example data:
data <- data.frame(lco =
                     c(338L, 6317L, 79L, 36L, 3634L, 8633L, 3231L, 27L, 173L, 5934L,
                       4476L, 1604L, 340L, 723L, 260L, 7008L, 7968L, 3854L, 4011L, 1596L,
                       1428L, 587L, 1595L, 32L, 277L, 5201L, 133L, 407L, 676L, 1874L,
                       1700L, 843L, 237L, 4270L, 2404L, 530L, 305L, 9344L, 720L, 1806L,
                       35L, 790L, 1383L, 5522L, 178L, 75L, 6219L, 121L, 923L, 1123L,
                       102L, 70L, 50L, 119L, 445L, 464L, 182L, 244L, 1358L, 7840L, 661L,
                       70L, 132L, 634L, 4262L, 1872L, 345L, 11L, 28L, 284L, 626L, 1033L,
                       26L, 798L, 13L, 480L, 44L, 339L, 259L, 312L, 262L, 67L, 1359L,
                       1835L, 13L, 189L, 292L, 2152L, 215L, 39L, 1131L, 1323L, 700L,
                       3271L, 1622L, 4669L, 125L, 281L, 277L, 232L, 1111L, 8669L, 7233L,
                       9363L, 400L, 502L, 1425L, 904L, 2924L, 927L, 31L, 1132L, 200L,
                       17L, 7602L, 12365L, 258L, 16L, 223L, 55L, 11L, 785L, 493L, 4L,
                       1161L, 393L, 791L, 30L, 568L, 386L, 75L, 1882L, 674L, 29L, 4217L,
                       332L, 103L, 332L, 30L, 168L, 277L, 176L, 49L, 19L, 76L, 144L,
                       145L, 65L, 52L, 391L, 25L, 104L, 484L, 20L, 12L, 188L, 5677L,
                       19L, 273L, 424L, 281L, 458L, 50L, 255L, 898L, 840L, 872L, 573L,
                       874L, 8L, 35L, 235L, 22L, 229L, 158L, 59L, 147L, 544L, 24L, 325L,
                       15L, 3L, 1531L, 1014L, 43L, 35L, 2176L, 934L, 253L, 69L, 784L,
                       352L, 188L, 27L, 1516L, 322L, 1394L, 7686L, 13L, 812L, 349L,
                       779L, 77L, 941L, 104L, 82L, 93L, 1206L, 24L, 6159L, 131L, 99L,
                       1310L, 27L, 520L, 327L, 350L, 42L, 102L, 25L, 14L, 42L, 33L,
                       469L, 177L, 119L, 64L, 75L, 190L, 82L, 82L, 473L, 51L, 9L, 49L,
                       41L, 221L, 1778L, 4188L, 4L, 86L, 39L, 93L, 35L, 44L, 227L, 636L,
                       589L, 332L, 22L, 15L, 50L, 147L, 32L, 134L, 133L, 629L, 168L,
                       69L, 747L, 34L, 20L, 552L, 8L, 54L, 28L, 1437L, 83L, 3225L, 776L,
                       784L, 247L, 33L, 40L, 368L, 104L, 420L, 357L, 9L, 164L, 7L, 227L,
                       142L, 33L, 91L, 78L, 175L, 194L, 294L, 433L, 52L, 7L, 372L, 29L,
                       220L, 371L, 375L, 233L, 12L, 35L, 795L, 35L, 43L, 50L, 57L, 32L,
                       162L, 124L, 160L, 52L, 132L, 131L, 50L, 117L, 145L, 33L, 83L,
                       33L, 123L, 43L, 27L, 91L, 25L, 2116L, 51L, 509L, 603L, 267L,
                       10L, 10L, 51L, 6028L, 99L, 597L, 53L, 131L, 1084L, 1222L, 153L,
                       70L, 746L, 437L, 82L, 299L, 1682L, 21L, 24L, 973L, 207L, 55L,
                       116L, 47L, 48L, 149L, 100L, 690L, 129L, 80L, 1143L, 103L, 50L,
                       242L, 708L, 316L, 83L, 61L, 15L, 203L, 435L, 474L, 47L, 718L,
                       21L, 33L, 27L, 15L, 53L, 97L, 6L, 39L, 59L, 255L, 51L, 15L, 20L,
                       514L, 74L, 20L, 319L, 14L, 14L, 45L, 36L, 625L, 5534L, 43L, 590L,
                       43L, 29L, 233L, 135L, 174L, 20L, 335L, 106L, 230L, 64L, 3551L,
                       524L, 72L, 44L, 16L, 98L, 37L, 62L, 390L, 83L, 28L, 3L, 63L,
                       32L, 124L, 56L, 149L, 11L, 153L, 661L, 15L, 25L, 49L, 626L, 141L,
                       38L, 23L, 123L, 530L, 47L, 6L, 18L, 222L, 391L, 71L, 75L, 234L,
                       142L, 45L, 439L, 675L, 14L, 53L, 19L, 100L, 51L, 147L, 10L, 141L,
                       979L, 97L, 330L, 112L, 71L, 4L, 9L, 124L, 141L, 145L, 302L, 122L,
                       435L, 50L, 81L, 99L, 330L, 84L, 41L, 227L, 4L, 37L, 5L, 99L,
                       210L, 7L, 183L, 67L, 98L, 157L, 96L, 150L, 22L, 288L, 391L, 188L,
                       54L, 56L, 49L, 618L, 160L, 631L, 9L, 355L, 56L, 119L, 37L, 36L,
                       153L, 110L, 126L, 335L, 121L, 80L, 113L, 62L, 97L, 22L, 72L,
                       1742L, 1007L, 11L, 121L, 27L, 62L, 823L, 56L, 40L, 26L, 69L,
                       120L, 516L, 11L, 146L, 245L, 174L, 1648L, 105L, 123L, 17L, 2565L,
                       138L, 200L, 46L, 130L, 189L, 87L, 191L, 143L, 76L, 702L, 79L,
                       67L, 166L, 3487L, 88L, 395L, 283L, 140L, 535L, 198L, 64L, 1033L,
                       376L, 180L, 14L, 32L, 441L, 361L, 520L, 62L, 247L, 10L, 24L,
                       721L, 176L, 164L, 33L, 44L, 12L, 30L, 13L, 157L, 122L, 161L,
                       45L, 34L, 538L, 74L, 14L, 19L, 15L, 1714L, 437L, 16L, 12L, 130L,
                       25L, 93L, 9L, 15L, 81L, 889L, 27L, 195L, 5L, 233L, 113L, 356L,
                       51L, 146L, 6822L, 65L, 166L, 45L, 18L, 295L, 196L, 145L, 256L,
                       14L, 8L, 89L, 32L, 20L, 239L, 68L, 63L, 21L, 102L, 158L, 1138L,
                       48L, 113L, 144L, 83L, 93L, 3L, 1032L, 45L, 36L, 68L, 146L, 370L,
                       25L, 10L, 290L, 858L, 19L, 17L, 64L, 42L, 38L, 711L, 144L, 58L,
                       144L, 1736L, 188L, 38L, 58L, 91L, 255L, 58L, 307L, 4L, 9L, 60L,
                       14L, 13L, 118L, 1549L, 108L, 483L, 34L, 1471L, 13L, 16L, 76L,
                       163L, 147L, 75L, 520L, 4L, 59L, 73L, 32L, 24L, 656L, 16L, 2655L,
                       38L, 20L, 1011L, 85L, 592L, 91L, 883L, 5174L, 42L, 17L, 88L,
                       21L, 61L, 33L, 1726L, 46L, 387L, 920L, 120L, 134L, 72L, 144L,
                       1603L, 646L, 45L, 282L, 56L, 19L, 41L, 69L, 151L, 632L, 47L,
                       48L, 126L, 114L, 119L, 144L, 949L, 67L, 144L, 27L, 61L, 70L,
                       287L, 64L, 323L, 27L, 149L, 1914L, 20L, 1077L, 21L, 70L, 59L,
                       123L, 537L, 131L, 1226L, 2908L, 8L, 133L, 42L, 175L, 100L, 162L,
                       494L, 414L, 2618L, 33L, 93L, 48L, 3676L, 553L, 705L, 58L, 268L,
                       141L, 284L, 98L, 135L, 13L, 49L, 792L, 128L, 172L, 236L, 221L,
                       596L, 35L, 241L, 10L, 193L, 189L, 26L, 27L, 47L, 100L, 398L,
                       21L, 26L, 86L, 147L, 3639L, 161L, 60L, 106L, 111L, 42L, 11L,
                       654L, 21L, 129L, 1152L, 224L, 49L, 12L, 22L, 73L, 207L, 165L,
                       113L, 12L, 1224L, 177L, 6L, 390L, 2747L, 23L, 46L, 1166L, 805L,
                       20L, 130L, 46L, 110L, 16L, 88L, 652L, 61L, 86L, 16L, 804L, 41L,
                       4383L, 511L, 126L, 549L, 23L, 45L, 80L, 162L, 127L, 700L, 43L,
                       147L, 102L, 84L, 67L, 57L, 30L, 55L, 274L, 314L, 847L, 203L,
                       322L, 8350L, 101L, 10L, 122L, 54L, 120L, 10L, 22L, 327L, 234L,
                       56L, 998L, 409L, 131L, 2163L, 81L, 19L, 6675L, 7L, 2182L, 1136L,
                       71L, 15L, 286L, 133L, 132L, 37L, 144L, 28L, 392L, 870L, 312L,
                       190L, 135L, 16L, 6L, 153L, 38L, 62L, 2710L, 36L, 61L, 37L, 88L,
                       375L, 88L, 131L, 73L, 212L, 918L, 185L, 53L, 143L, 69L, 2231L,
                       54L, 23L, 220L, 195L, 468L, 2009L, 364L, 54L, 277L, 1547L, 240L,
                       1700L, 1533L, 374L, 363L, 35L, 97L, 19L, 87L, 67L, 22L, 267L,
                       16L, 11L, 35L, 460L, 44L, 58L, 26L, 13L, 172L, 114L, 272L, 64L,
                       254L, 49L, 440L, 329L, 48L, 93L, 10L, 70L, 17L, 120L, 5229L,
                       118L, 133L, 43L, 2419L, 207L, 102L, 90L, 127L, 3939L, 14L, 5L,
                       552L, 425L, 656L, 511L, 170L, 396L, 177L, 3680L, 111L, 21L, 320L,
                       367L, 51L, 672L, 1675L, 59L, 91L, 281L, 113L, 19L, 37L, 65L,
                       288L, 27L, 149L, 61L, 63L, 75L, 165L, 90L, 9L, 12L, 82L, 111L,
                       157L))
Code:
# lorenz curve of user contribution
library(ineq)
library(ggplot2)
library(scales)
library(grid)
# compute lorenz curve
lcolc <- Lc(data$lco)
# bring lorenz curve in another format easily readable by ggplot2
# namely reverse the L column so that lorenz curve is mirrored on diagonal
# p stays p (the diagonal)
# Uprob contains the indices of the L's, but we need percentiles
lcdf <- data.frame(L = rev(1-lcolc$L), p = lcolc$p, Uprob = c(1:length(lcolc$L)/length(lcolc$L)))

# basic plot with the diagonal line and the L line
p <- ggplot(lcdf, aes(x = Uprob, y = L)) + geom_line(colour = hcl(h=15, l=65, c=100)) + geom_line(aes(x = p, y = p))
# compute annotation lines at 50 percent L (uses a heuristic)
index  <- which(lcdf$L >= 0.499 & lcdf$L <= 0.501)[1]

ypos <- lcdf$L[index]
yposs <- c(0,ypos)
xpos <- index/length(lcdf$L)
xposs <- c(0,xpos)
ypositions <- data.frame(x = xposs, y = c(ypos,ypos))
xpositions <- data.frame(x = c(xpos,xpos), y = yposs)
# add annotation line
p <- p + geom_line(data = ypositions, aes(x = x, y = y),
                   linetype="dashed") + geom_line(data = xpositions, aes(x = x, y = y),
                                                  linetype="dashed")
# set axes and labels (namely insert custom breaks in scales)
p <- p + scale_x_continuous(breaks=c(0, xpos,0.25,0.5,0.75,1),
                            labels = percent_format()) + scale_y_continuous(
                                                                            labels = percent_format())
# add minimal theme
p <- p + theme_minimal() + xlab("Percentage of objects") + ylab("Percentage of events")
# customize theme
p <- p + theme(plot.margin = unit(c(0.5,1,1,1), "cm"),
               axis.title.x = element_text(vjust=-1),
               axis.title.y = element_text(angle=90, vjust=0),
               panel.grid.minor = element_blank(),
               plot.background = element_rect(fill = rgb(0.99,0.99,0.99), linetype=0))
# print plot
p
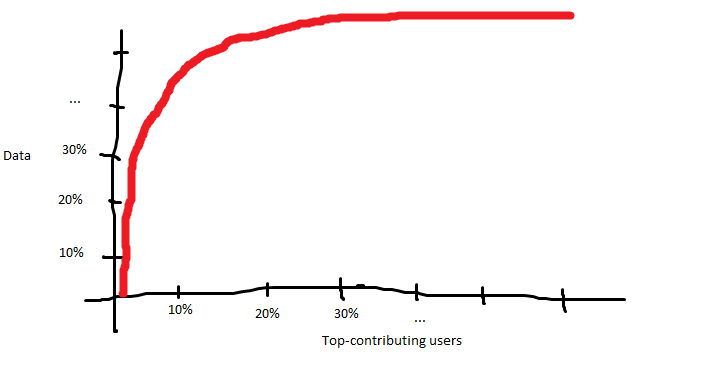

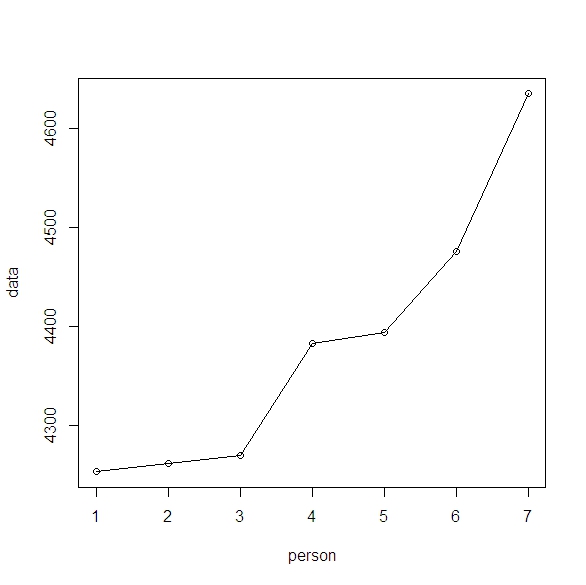
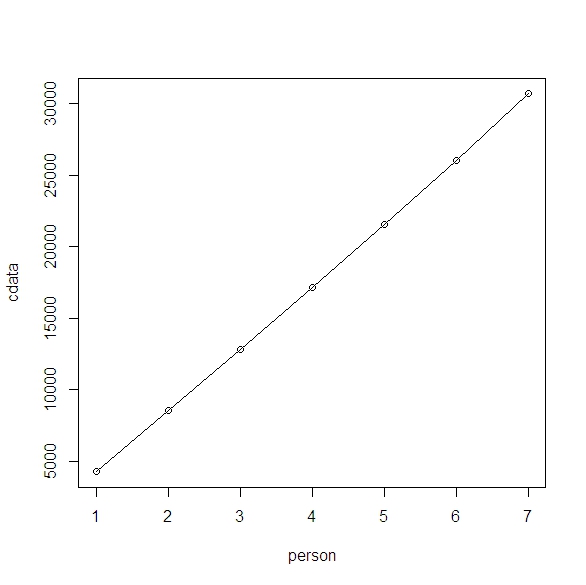
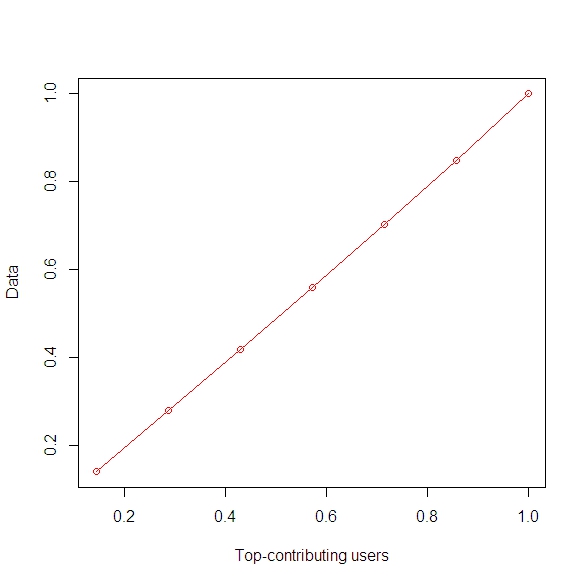

ecdfinRfor a start. The term is "empirical cumulative distribution function." You might also be interested in "probability plots" and "QQ plots" as well: they are versions of the ECDF showing the data on different (nonlinear) scales. $\endgroup$ecdfand have used it before, but in the "classic" way that the x-axis shows the number of postings and the y-axis their probability. I don't know how to do something like above. $\endgroup$