I am wanting to find the correlation between two variables: a categorical vegetation variable (with categories 1-4) and a continuous variable of erosion (with values anywhere between 0.2 and 9). I think I would be required to use a non parametric test to find the correlation, but bit of a newby to stats so could anyone suggest the best test to use? I also wanted to know how sample size can affect these tests, ie with a sample size of 100 or 1000?
-
$\begingroup$ I would think in terms of a regression model using indicator or dummy variables for vegetation, but make sure you plot your data first. Consider also log scale for erosion, or more generally a scale on which variability of erosion is about the same in each category. $\endgroup$– Nick CoxCommented Sep 12, 2013 at 5:05
2 Answers
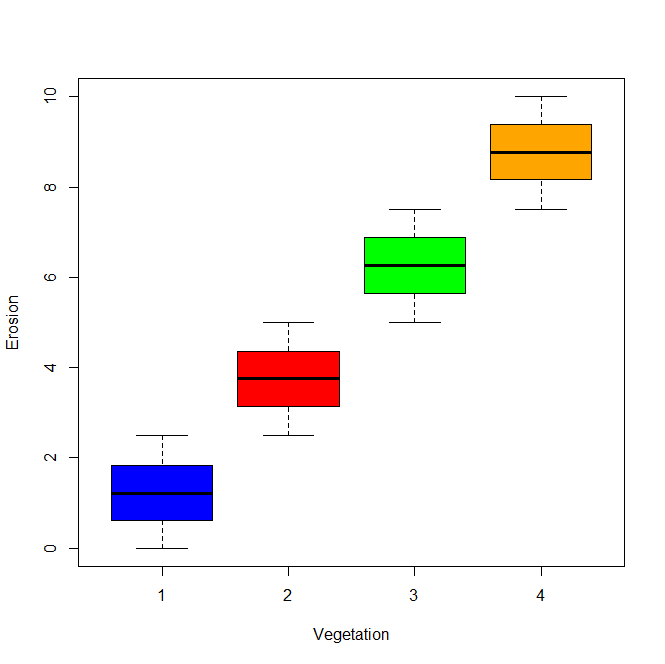
I agree with @John's answer but would also suggest simply plotting boxplots of erosion for each vegetation category. If the vegetation variable actually has a ordinal interpretation then we could draw some exploratory conclusions about correlations between vegetation and erosion. For example, consider the following fictional data and corresponding box plot.

So as you can see from the box plots, there would appear to be a positive correlation (or association if you prefer that jargon) between erosion and vegetation level. (Of course this argument requires vegetation categories have an ordinal meaning)
Here is the code to generate this in R although I know you didn't ask for it and clearly one of your tags is for SPSS.
#Pseudo Data
N = 10000
erosion = runif(N,0,10)
vegetation = rep(1,N)
vegetation[erosion > 2.5 & erosion <= 5] = 2
vegetation[erosion > 5 & erosion <= 7.5] = 3
vegetation[erosion > 7.5 & erosion <= 10] = 4

boxplot(erosion~vegetation,col=c("blue","red","green","orange"),
        xlab="Vegetation",ylab="Erosion")
-
$\begingroup$ BabakP, it's unclear in your answer whether you're arguing that it's OK to use something like a Spearman if the categories were expected to be ordinal, or if post hoc you ordered them and then measured the correlation Although you certainly imply the former I can see how someone could infer the latter. Expected order and post hoc have very different implications for things like a significance test. (On the other hand, if you're just suggesting the boxplots, or perhaps an ANOVA or confidence intervals, then the ordering doesn't really matter at all anyway.) $\endgroup$– JohnCommented Sep 12, 2013 at 14:11
-
$\begingroup$ I understand your concerns but all I am suggesting is that before you do perform any statistical tests is to do some exploratory analysis to see if the data suggest any possible correlation structure (graphically). I further argue that if the data has an ordinal structure then it is easy to use boxplots to check (at an exploratory level) whether or not there is correlation between the independent and dependent variables. $\endgroup$– user25658Commented Sep 12, 2013 at 14:49
-
$\begingroup$ OK, so you are suggesting post hoc ordering...just checking. $\endgroup$– JohnCommented Sep 12, 2013 at 17:32
-
$\begingroup$ I don't believe I am suggesting post-hoc ordering (if I understand the definition of post-hoc). For example, had the categorical variable been age (instead of vegetation) binned into categories (i.e., 0-20, 20-40,...etc) then there is a natural ordinal structure to that variable that is not created post-hoc. So I was merely suggesting that if vegetation has some sort of inherit ordinal structure then....you know the rest. $\endgroup$– user25658Commented Sep 12, 2013 at 17:36
You could calculate a $\chi^2$ and the $\Phi$ coefficient measure as a substitute for correlation. $\Phi$ would have a similar interpretation to a Pearson correlation coefficient but should really only be used in 2x2 designs. In your case you should probably go with a Cramer's V which is standardized but doesn't quite have the correlation style interpretation. There is no nonparametric comparable linear correlation because one of your variables is purely categorical. Those numbers 1-4 labelling your categories could be arbitrarily reassigned to different categories and it wouldn't affect the true relationship but it would affect something like a Spearman correlation coefficient.
Unfortunately, the above tactic wouldn't really treat your continuous variable fairly. Another way to get a correlation(ish) value is to perform an ANOVA with your continuous variable as response and categorical as predictor and then calculate $\eta^2$ (eta-squared) effect size measure. That effect size has an interpretation that's similar to $R^2$.
Your second query about sample size has a fixed answer for all tests and estimates. The larger the sample, the more likely the test is to be significant. Increasing sample size increases the accuracy of your effect estimates ($\Phi$ or $\eta^2$, or any parameter estimates you're making).
-
$\begingroup$ Thankyou. Sorry, but I also just wanted to clarify what both of those symbols mean? $\endgroup$ Commented Sep 12, 2013 at 6:43
-
$\begingroup$ $\chi^2$ is a Pearson's Chi-Squared Test and the $\Phi$ coefficient is the Phi Coefficient $\endgroup$ Commented Sep 12, 2013 at 11:48
