10
$\begingroup$

I got a revision for my research paper recently and the following is the reviewer's comment on my paper:

results obtained from one model is not quite convincing especially linear regression usually has deficiencies in dealing with outliers. I suggest the authors also try logistic regression and compare the corresponding results with current results. If the similar observations are obtained, the results would be more solid.

Is the reviewer's comment right? Is logistic regression better than multiple linear regression?

The problem is that my dependent variable is not categorical, it's a scale variable. What can I do now? What other regression method do you recommend to evaluate my model?

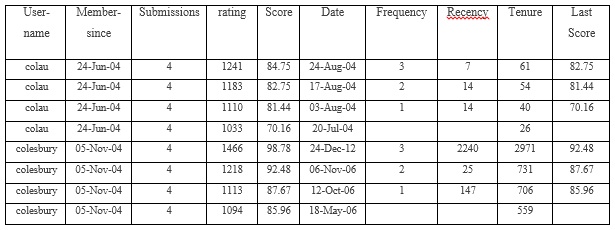
Score is dependent variable in the following table. Recency, frequency, tenure and last score are independent variables.
enter image description here

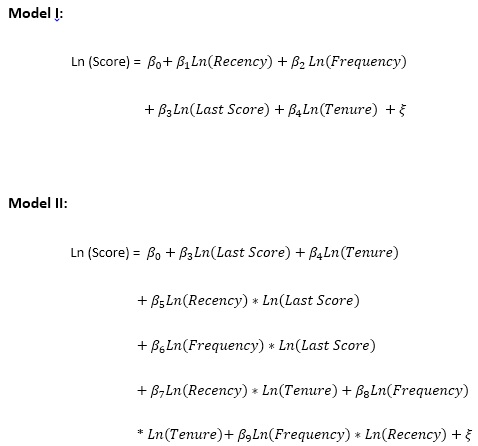
I've extracted these variables from a site and I hypothesize that these independent variables have significant effect on the score. Therefore, I represent the following models:
enter image description here


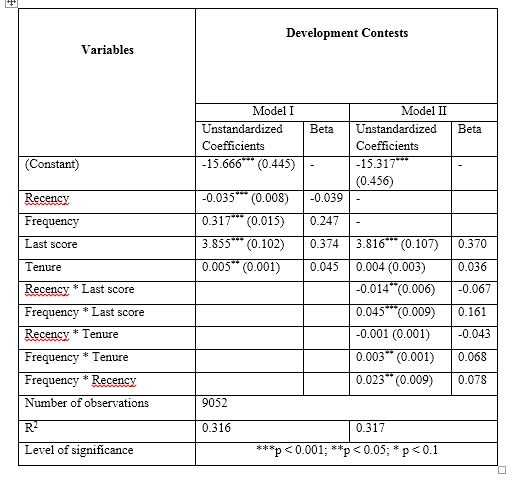
By the way, the value of R squared for this linear model is 0.316! The reviewer also commented on this value too:

then the results are not convincing as there is no indicator on the quality of learned coefficients. A small R^2 cannot indicate good performance as the model may be over-fitted.

Is 0.316 very low for R squared? In previous papers I saw the similar values a lot.
enter image description here

$\endgroup$
12
  • $\begingroup$ This is a minor point, but understanding how the score is computed can be helpful in providing good answers. Could you edit your question to inform us about that? $\endgroup$
    – whuber
    Commented Sep 12, 2013 at 19:06
  • $\begingroup$ I edit my post. my statistical knowledge is not good. I would be very thankful if you help. $\endgroup$
    – PSS
    Commented Sep 12, 2013 at 19:18
  • 1
    $\begingroup$ is not there any idea about running logistic regression on continuous dependent variable??? $\endgroup$
    – PSS
    Commented Sep 13, 2013 at 14:52
  • 1
    $\begingroup$ Is the score something that has to be between 0 and 100? In that case you could divide by 100 and do a logistic regression on the resulting variable, which would always be between 0 and 1...feels a bit odd doing things that way, and I'm not sure how sensible it is, but maybe that's what the reviewer is suggesting? $\endgroup$ Commented Sep 13, 2013 at 15:14
  • 2
    $\begingroup$ No, scaling to 0-1 or discarding valuable information y categorizing the score are not good solutions at all. $\endgroup$ Commented Oct 4, 2014 at 12:29

4 Answers 4

6
$\begingroup$

The proportional odds ordinal logistic regression model should work fine for this problem. For an efficient implementation that can allow thousands of unique $Y$ values see the orm function in the R rms package.

$\endgroup$
2
  • $\begingroup$ I installed R and all necessary packages. would you please provide some example for orm function? I didn't find by searching. For my regression model, what the code should be? $\endgroup$
    – PSS
    Commented Sep 14, 2013 at 9:23
  • 1
    $\begingroup$ It's worth spending time studying the documentation. See Handouts under biostat.mc.vanderbilt.edu/CourseBios330 for a detailed case study with code - the chapter on Regression Models for Continuous $Y$. $\endgroup$ Commented Sep 14, 2013 at 12:14
0
$\begingroup$

you could also try ordered probit/logit models by assigning values 1, 2,3, and 4 to scores in the 1st,.....,4th percentiles respectively.

$\endgroup$
1
  • $\begingroup$ Which variable are you proposing reducing to its lowest four percentiles (out of 100)? What would this accomplish and why? $\endgroup$
    – whuber
    Commented Sep 30, 2015 at 0:16
0
$\begingroup$

It is possible to apply logistic regression even to a contiuous dependent variable. It makes sense, if you want to make sure that the predicted score is always within [0, 100] (I judge from your screenshots that it is on 100-point scale).

To accomplish it, just divide your score by 100, and run logistic regression with this [0,1]- based target variable, like in this question - you can do it, for example, with R, using

glm(y~x, family="binomial", data=your.dataframe)

I don't know whether this approach helps with outliers - it depends on the sort of outliers you are expecting. But sometimes it improves goodness of fit (even $R^2$, if your dependent variable has natural lower and upper bounds.

As for the second question, $R^2\approx 0.3$ may be the best what you can squeeze out of your data, without overfitting. If you build your model for the purpose of inference, low $R^2$ is totally fine, as long as the coefficients important to you are significant. If you want to check whether the model is overfitted, you can check its $R^2$ on a test set, or even do a cross-validation.

$\endgroup$
1
  • $\begingroup$ Fully agree. You indeed can use logistic regression for continuous outcomes lying in [0,1]. $\endgroup$
    – Viktor
    Commented Jun 2 at 12:27
-1
$\begingroup$

You could dichotomise (convert to a binary variable) the score. If score is from 0 to 100 then you could assign 0 to any score less than 50 and 1 otherwise. I've never heard before that this a good way of dealing with outliers though. This might just hide outliers since it will be impossible to distinguish very high or low scores. This doesn't make a great deal of sense to me but you can try it.

More importantly why are you log transforming all your covariates and your response variable? This is going to affect your $\beta$ estimates and your $R^2$ (i think).

Also the reviewer says a small $R^2$ suggests overfitting? I thought overfitting was when your $R^2$ is high but your model performs poorly on new data (i.e it overfits your data but doesn't generalise to new data). Overfitting tends to happen when you have few observations which you are trying to predict with a large number of parameters. This is what you are doing in your Model 2 since you have 8 observations which you are trying to explain with 7 parameters.

I am not going to pretend I know a great deal about statistics but it seems to me, based on his comments, that this reviewer might know even less.

$\endgroup$
5
  • $\begingroup$ Thanks a lot for your reply. Because all variables are skewed, so I have them natural log-transformed. Am I right? Thank you for clarifying what "overfitting" means ! Actually, I didn't know what overfitting means. Now, I can reply to reviewer and editor. By the way, what's your recommendation for me to make my evaluation more solid? what regression method do you think is better? $\endgroup$
    – PSS
    Commented Sep 14, 2013 at 4:32
  • 6
    $\begingroup$ Don't dichotomize $Y$ for any reason. $\endgroup$ Commented Sep 14, 2013 at 12:12
  • $\begingroup$ I agree with @FrankHarrell that choosing an arbitrary threshold to dichotomise your data doesn't make any sense. Is this your entire dataset? If you have so few observations your data is never going to look normally distributed! Also you need to understand the type of data your are dealing with too. What range of values can they take, is it sensible to assume they should be normally distributed? I am going to look into Frank's suggestion of using ordinal logistic regression, but my guess is that it uses the order of the scores instead of their value in the regression. $\endgroup$
    – pontikos
    Commented Sep 14, 2013 at 12:56
  • $\begingroup$ @PotentialScientist, it doesn't matter if your distributions are skewed. In OLS (typical) regression, only the distribution of the residuals matters, see here: what-if-residuals-are-normally-distributed-but-y-is-not. You might also want to read this: interpretation-of-log-transformed-predictor, to understand what has happened to your model as a result of transforming your predictors. $\endgroup$ Commented Sep 14, 2013 at 12:57
  • $\begingroup$ @PotentialScientist how are you getting on? If you edit your question to provide the data in CSV format I can try to run the orm function suggested by Prof Harrell and we can analyse the output. It's worth you learn the basics of R (how to read in a file and run a regression). $\endgroup$
    – pontikos
    Commented Sep 16, 2013 at 9:01

Your Answer

By clicking “Post Your Answer”, you agree to our terms of service and acknowledge you have read our privacy policy.

Not the answer you're looking for? Browse other questions tagged or ask your own question.