2
$\begingroup$

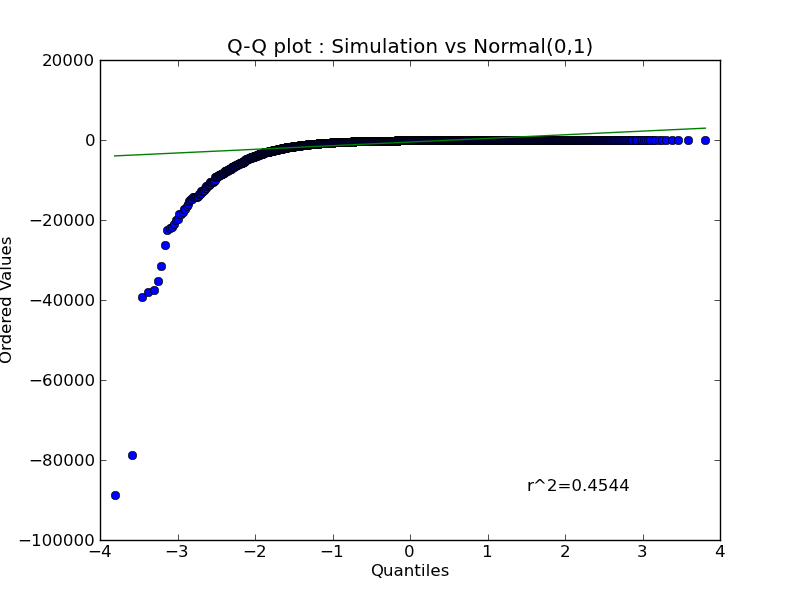
With 10 thousands, Monte Carlo simulation, I have generated the Q-Q plot enter image description here

Is it possible to infer what distribution follows my sample?

I'm new to Q-Q plot.
As far as I understand, the sample is not normal distributed because the dot are not on the line.
But, then, which distribution behave like that?

This is related to this question.

Edit
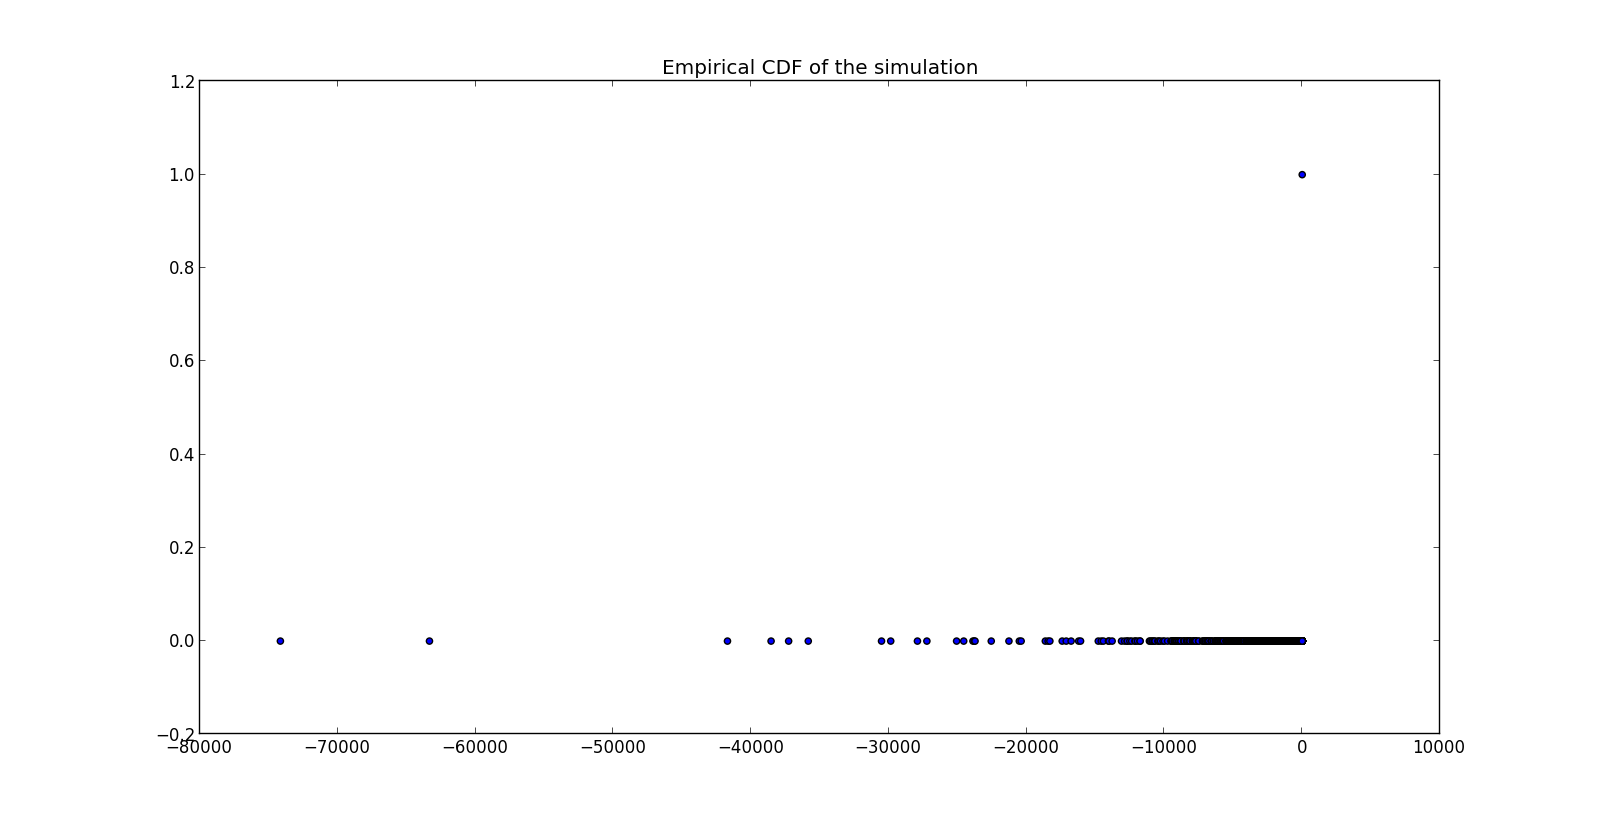
To give an idea of the data, here is the empirical cumulative distribution function of the sample enter image description here

$\endgroup$
4
  • 1
    $\begingroup$ You're correct, this data is certainly non-Normal. I'm not sure that, one can generally work backward from a Q-Q plot to find the underlying distribution (without significant trial-and-error or assumptions of the data). What does the data itself look like? $\endgroup$
    – user32490
    Commented Mar 27, 2014 at 19:34
  • 2
    $\begingroup$ You won't get a functional form from a sample. However, you can see particular information from the QQ plot that may help in identifying a reasonable model. The data are plainly quite left-skew, with a heavy tail on that side, and they seem to have 0 (or a value close to in on this scale) as an upper bound. $\endgroup$
    – Glen_b
    Commented Mar 27, 2014 at 23:58
  • $\begingroup$ @leonardo I have added the empirical cdf of the data, to give an idea of what they look like. At least, from the Q-Q plot, I would like to derive a few good families of distributions for my fitting trials. $\endgroup$
    – user21186
    Commented Mar 28, 2014 at 0:42
  • 2
    $\begingroup$ I think you're over-complicating this. If you just want to know the approximate distribution of the data, why not just plot the histogram and do a curve fit instead? $\endgroup$
    – rocinante
    Commented Mar 28, 2014 at 4:48

1 Answer 1

0
$\begingroup$

Judging from empirical CDF, this distribution is strange indeed. It simply looks like a value of 0 with 99.99% frequency, plus a smattering of large negative values. Is a lot of rounding involved?

With the highly skewed (non-symmetrical) distribution like this, the first thing I'd do is to take log(-X), where X are your sample values. If there are a lot of zeros, then you deal with censoring which is a rather complicated topic and you'll need to talk to a professional. A simple practical fix is just skip the zeros for now and work with strictly negative part of your sample.

EDIT: after looking at your original post, I notice that X is related to the stock price. IF this is a result of using some kind of geometric random walk (multiplying by some number at each step, for example), then it makes sense to do the entire simulation on the log scale (i.e. turn your multiplications into additions), then you will not get into the whole machine rounding situation and your X-values will be more meaningful.
$\endgroup$

Your Answer

By clicking “Post Your Answer”, you agree to our terms of service and acknowledge you have read our privacy policy.