0
$\begingroup$

I am trying fit an ARIMA model to stock returns.

I have reached a decent model using the AIC criterion.

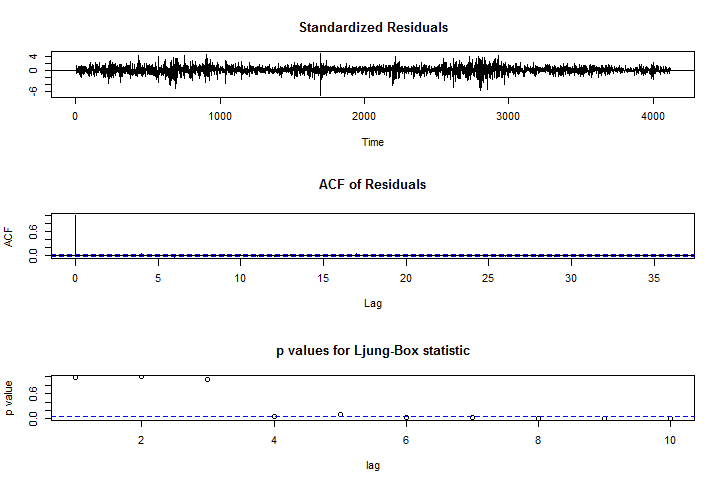
However, the ljung-box p value under a diagnostic plots are pretty weird. The null hypothesis get rejected at higher lags. I tried modifying the parameters, but L-B p value betters only marginally, with a loss in AIC.

Any help how I can balance the two ? Also any reasons why the p-value is so low for higher lags.

Ihave attached the diagnostic's image:
tsdiag

$\endgroup$

1 Answer 1

2
$\begingroup$

Your residuals look like they are white noise so your series should be stationary and modelled correctly. The Ljung-Box Q null hypothesis is that there is no autocorrelation in the errors. A Ljung-Box Q p-value above your chosen confidence level indicates that you have no evidence against the null of no autocorrelation.

You can always try to take log of your series in order to stabilize the variance but as it looks here everything seems fine. Perhaps you could post your model and test statistics, perhaps even your data. Post your model + test statistics and/or your data to get a better response!

Remember that you want a high Ljung-Box Q p-value!

$\endgroup$

Your Answer

By clicking “Post Your Answer”, you agree to our terms of service and acknowledge you have read our privacy policy.

Not the answer you're looking for? Browse other questions tagged or ask your own question.