2
$\begingroup$

I'm struggling with two exercises for which I do possess answers, but I have no idea why they would be like that. I haven't done any statistics in a long time (restarting studies).

Question 1

Two buddies agreed to come to a meeting between 1 pm and 2 pm. Each one will come at random time and will be waiting for 20 minutes before going back home. What's the chance for them to meet?

I have an answer written down as 5/9 (to be more specific, (3600-1600)/3600)
It seems to be done by contradiction, but I haven't yet come to a conclusion what kind.

Question 2

Over a section $AB$ which has a length of $l$, two points $M$ and $L$ were chosen randomly. Find the probability of $L$ being closer to the $M$ than $A$.

So what I have is something like this:
$$ A-------L-------M-------B $$ where $|AL| = x$ and $|AM| = y$. I concluded that in order for $L$ to be closer to $M$ than $|AM|$ there must be such that $|y-x|< x$, that is $-x < y-x < x$, so $y>0$ and $y<2x$.
So my question is, how do I get the probability from this equation? (default answer is 3/4)

$\endgroup$

3 Answers 3

3
$\begingroup$

A quick and easy way to address both questions is to plot the events. Because the distributions of all the variables involved--arrival times of the buddies and locations of the points--are all uniform, the area of the plot (relative to the total area that could be plotted) gives the answer.

1. The Buddies Meet

Let $X$ be the time the first buddy arrives and $Y$ the time the second one does. The condition of their meeting, measured in hours, is

$$X \le Y \le X + 20/60\text{ or } Y \le X \le Y + 20/60.$$

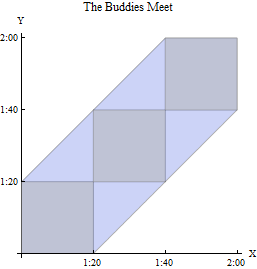
The plot of these points can be seen to comprise three squares, of $20/60=1/3$ hour on a side, plus two sets of diagonal half-squares of the same size. That's the equivalent of five such squares. Each square has $(1/3)^2=1/9$ the area of the whole square covering all possible arrival times $(X,Y)$ between $1$ and $2$ pm, whence the answer is $5/9$.

Figure 1

2. A Point Proximity Problem

This time, in the $(L,M)$ plane, the event is

$$|L-M| \lt |L-A|.$$

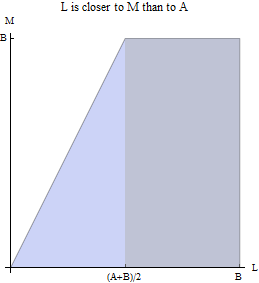
Geometrically it comprises a rectangle of base $(B-A)/2$ and height $(B-A)$ adjoined to a diagonal half-rectangle of the same dimensions. Clearly these fill $3/4$ of the area of the square $[A,B]\times [A,B]$.

Figure 2


Even in more complicated problems involving non-uniform univariate, bivariate, (or even trivariate) probabilities, drawing pictures of events is often very helpful for understanding how to set up and compute the integrals that must be evaluated.

$\endgroup$
2
$\begingroup$

Since the question is flagged as self-study, I'll just provide some hints to (hopefully) help you derive the solution. I'll amend/complete my answer based on your progress.

Question 1

As a starting point, you might want express the information provided in the problem with some mathematical notation. To do so, define two (continuous) random variables, say $X$ and $Y$, corresponding to the arrival times (in minutes after 1pm) of the two buddies. What are the conditions on $X$ and $Y$ for the two buddies to meet, i.e., what is the domain of values for $X$ and $Y$ where the two buddies meet?

To compute the requested probability, one needs to know the joint distribution of $X$ and $Y$. It is not explicitly provided in the question; I'll assume that $X$ and $Y$ are independant and uniformly distributed on $[0, 60]$.

You have (at least) two options here. The first approach is based on a geometric reasoning and works it only because the variables are independant and uniformly distributed. The requested probability is given by the ratio of the area of domain of $X$ and $Y$ where the two buddies meet and the total area of the domain of possible vaues for $X$ and $Y$.

In the second approach the requested probability is obtained by integrating the joint density on the domain of $X$ and $Y$ corresponding to situations where the two buddies meet.

$\endgroup$
3
  • $\begingroup$ For those who struggle with the same kind of task, this link mathpages.com/home/kmath124/kmath124.htm provided me a satisfying reasoning to solve this (and Quantibex suggestion to use geometry) $\endgroup$
    – Michael
    Commented Apr 5, 2014 at 18:57
  • $\begingroup$ Ok, then would you consider to add your solution to the question so that others could benefit from it? $\endgroup$
    – QuantIbex
    Commented Apr 7, 2014 at 19:52
  • 1
    $\begingroup$ Even if the X and Y are not uniformly distributed, you should still be able to use this approach (assuming you know their actual distributions). You'll just need to integrate over the domain instead of just computing the relative area (which is basically integrating a constant function anyway). $\endgroup$
    – Hao Ye
    Commented Jun 13, 2014 at 19:21
0
$\begingroup$

For question 2 here are some things to consider.

This all assumes that the points will be placed based on a uniform distribution (reasonable but unstated assumption).

Your drawing shows the order A L M B, but from the description it seems that you could also see A M L B, in the later case L will always be closer to M than to A, what is the probability of seeing A M L B and seeing A L M B?

Now conditioning on the order A L M B, think about having placed M (and A is already there) and we know that L will fall between A and M, what proportion of the line will have L closer to A? closer to M?

Combine the answers to the 2 questions and you should see $\frac34$.

$\endgroup$

Your Answer

By clicking “Post Your Answer”, you agree to our terms of service and acknowledge you have read our privacy policy.

Not the answer you're looking for? Browse other questions tagged or ask your own question.