Cost-sensitive classification metrics are somewhat common (whereby correctly predicted items are weighted to 0 and misclassified outcomes are weighted according to their specific cost). Some examples of implementations: mlr, tidymodels, costcla. For example:
$$ outcomeWeights = \left(\begin{array}{cc} 0 & 1\\3 & 0 \end{array}\right)$$
However other types of 'value' based weighting of the cells of confusion matrices seem to be less common. I have two questions:
- Are other types of cell weights on a confusion matrix appropriate? (E.g. weighting based on the value associated with the cell not strictly the cost)
- If yes, are weighted versions of common classification metrics appropriate to calculate (e.g. precision, recall, auc, etc.)?
For example: $$ outcomeWeights = \left(\begin{array}{cc} 0.14 & 1.89\\1.86 & 0.11 \end{array}\right)$$
Example
Say for instance we first generate a confusion matrix on a set of predictions
``` r
library(tidyverse)

set.seed(1234)

df <- tibble(class = c(rep(TRUE, 100), rep(FALSE, 100)),
             pred_prob = runif(200, 0, 1)) %>%
  mutate(pred_class = pred_prob > 0.5) %>%
  select(class, contains("pred")) %>%
  mutate(across(contains("class"), factor, c("TRUE", "FALSE")))

confusion_matrix <- yardstick::conf_mat(df, class, pred_class)

confusion_matrix
#>           Truth
#> Prediction TRUE FALSE
#>      TRUE    45    52
#>      FALSE   55    48
```
But for business reasons we apply the weights mentioned previously
```r
outcome_weights <- matrix(
  c(0.14, 1.89, 1.86, 0.11),
  ncol = 2,
  byrow = TRUE
  )

confusion_matrix$table <- confusion_matrix$table * outcome_weights

confusion_matrix
#>           Truth
#> Prediction   TRUE  FALSE
#>      TRUE    6.30  98.28
#>      FALSE 102.30   5.28
```
Would common classification metrics be appropriate to review still (now in a weighted form)? For example at a specific decision threshold:
```r
summary(confusion_matrix)
#> # A tibble: 13 x 3
#>    .metric              .estimator .estimate
#>    <chr>                <chr>          <dbl>
#>  1 accuracy             binary        0.0546
#>  2 kap                  binary       -0.890
#>  3 sens                 binary        0.0580
#>  4 spec                 binary        0.0510
#>  5 ppv                  binary        0.0602
#>  6 npv                  binary        0.0491
#>  7 mcc                  binary       -0.891
#>  8 j_index              binary       -0.891
#>  9 bal_accuracy         binary        0.0545
#> 10 detection_prevalence binary        0.493
#> 11 precision            binary        0.0602
#> 12 recall               binary        0.0580
#> 13 f_meas               binary        0.0591
```
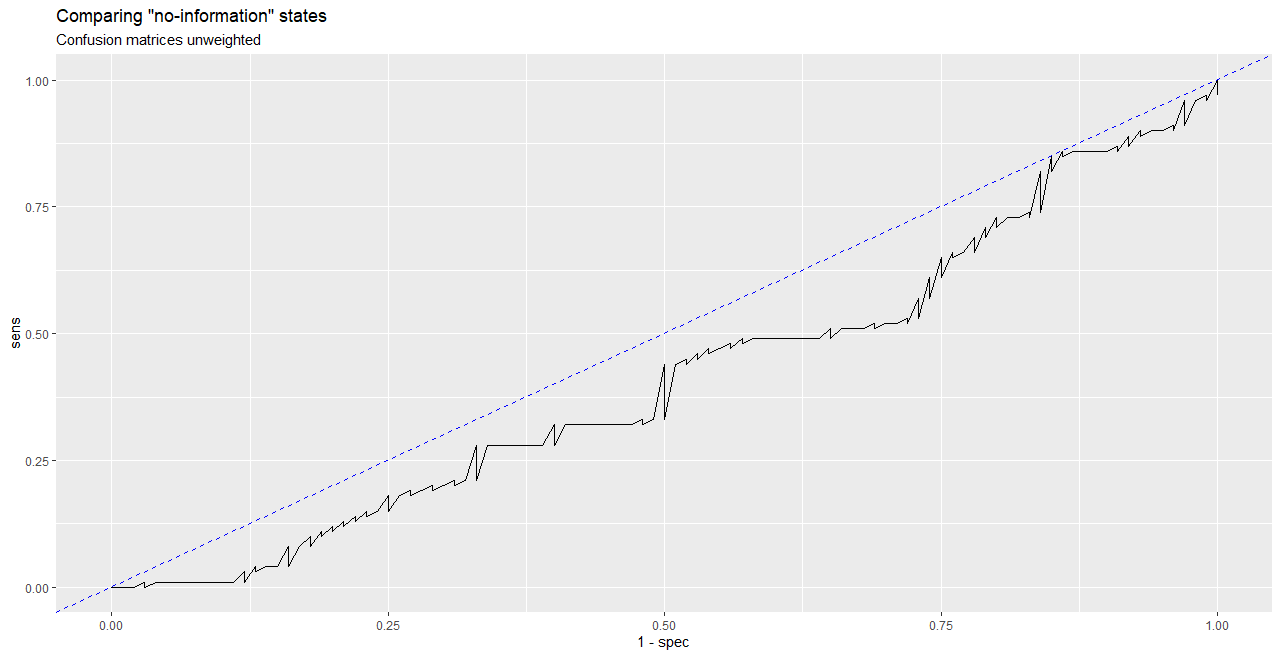
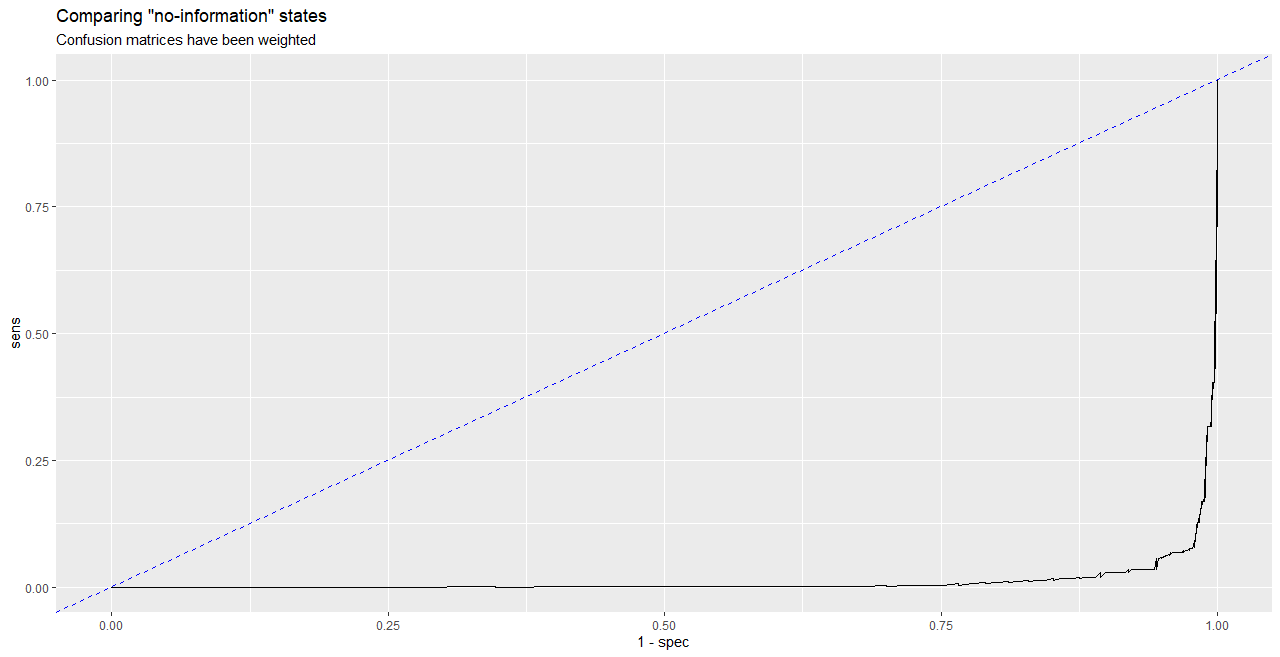
Or across thresholds as in weighted AUC or ROC curve or precision-recall curves?
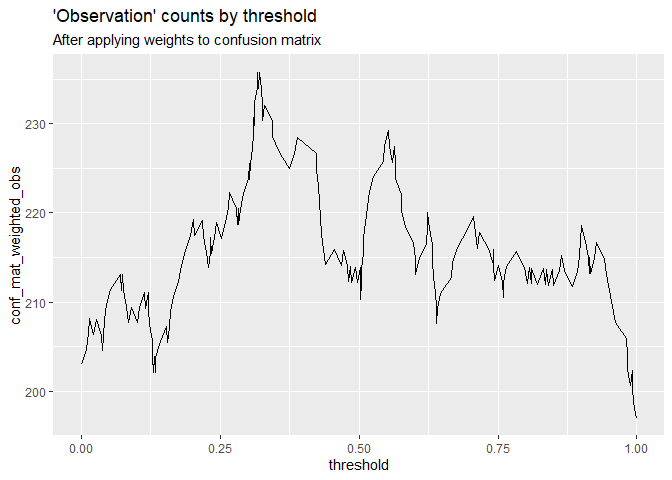
Does the fact that the sum of the cells of the confusion matrix is different from the observation count make these weighted metrics inappropriate (and also that the sum of cell counts can change depending on the decision threshold)?
For example in the unweighted example we have a sum across cells of 200 (the number of observations) whereas in the second case we have 207. The number of 'weighted' observations hence will vary between decision thresholds (shown below):
```r
weight_cells <- function(confusion_matrix, weights = matrix(rep(1, 4), nrow = 2)){

  confusion_matrix_output <- confusion_matrix
  confusion_matrix_output$table <- confusion_matrix$table * weights
  confusion_matrix_output
}

conf_mat_threshold <- function(df_input = df,
                               threshold = 0.5){
  hard_pred <- df_input %>%
    mutate(pred_class = pred_prob > threshold) %>%
    mutate(across(contains("class"), factor, c("TRUE", "FALSE")))

  yardstick::conf_mat(hard_pred, class, pred_class)
}

thresholds <- tibble(threshold = c(0, unique(df$pred_prob), 1)) %>%
  arrange(threshold)

conf_matrix_thresholds <- thresholds %>%
  mutate(conf_mat = map(threshold, conf_mat_threshold, df_input = df)) %>%
  mutate(conf_mat_weighted = map(conf_mat, weight_cells, weights = outcome_weights))

conf_matrix_thresholds %>%
  mutate(obs = map_dbl(conf_mat_weighted, ~sum(.x$table))) %>%
  mutate(across(contains("conf"), list(obs = ~map_dbl(.x, ~sum(.x$table))))) %>%
  ggplot(aes(x = threshold, y = conf_mat_weighted_obs))+
  geom_line()+
  labs(title = "'Observation' counts by threshold",
       subtitle = "After applying weights to confusion matrix")
```


