2
$\begingroup$

Cost-sensitive classification metrics are somewhat common (whereby correctly predicted items are weighted to 0 and misclassified outcomes are weighted according to their specific cost). Some examples of implementations: mlr, tidymodels, costcla. For example:

$$ outcomeWeights = \left(\begin{array}{cc} 0 & 1\\3 & 0 \end{array}\right)$$

However other types of 'value' based weighting of the cells of confusion matrices seem to be less common. I have two questions:

  1. Are other types of cell weights on a confusion matrix appropriate? (E.g. weighting based on the value associated with the cell not strictly the cost)
  2. If yes, are weighted versions of common classification metrics appropriate to calculate (e.g. precision, recall, auc, etc.)?

For example: $$ outcomeWeights = \left(\begin{array}{cc} 0.14 & 1.89\\1.86 & 0.11 \end{array}\right)$$

Example

Say for instance we first generate a confusion matrix on a set of predictions

``` r
library(tidyverse)

set.seed(1234)

df <- tibble(class = c(rep(TRUE, 100), rep(FALSE, 100)),
             pred_prob = runif(200, 0, 1)) %>% 
  mutate(pred_class = pred_prob > 0.5) %>% 
  select(class, contains("pred")) %>% 
  mutate(across(contains("class"), factor, c("TRUE", "FALSE")))

confusion_matrix <- yardstick::conf_mat(df, class, pred_class)

confusion_matrix
#>           Truth
#> Prediction TRUE FALSE
#>      TRUE    45    52
#>      FALSE   55    48
```

But for business reasons we apply the weights mentioned previously

```r
outcome_weights <- matrix(
  c(0.14, 1.89, 1.86, 0.11),
  ncol = 2,
  byrow = TRUE
  )

confusion_matrix$table <- confusion_matrix$table * outcome_weights

confusion_matrix
#>           Truth
#> Prediction   TRUE  FALSE
#>      TRUE    6.30  98.28
#>      FALSE 102.30   5.28
```

Would common classification metrics be appropriate to review still (now in a weighted form)? For example at a specific decision threshold:

```r
summary(confusion_matrix)
#> # A tibble: 13 x 3
#>    .metric              .estimator .estimate
#>    <chr>                <chr>          <dbl>
#>  1 accuracy             binary        0.0546
#>  2 kap                  binary       -0.890 
#>  3 sens                 binary        0.0580
#>  4 spec                 binary        0.0510
#>  5 ppv                  binary        0.0602
#>  6 npv                  binary        0.0491
#>  7 mcc                  binary       -0.891 
#>  8 j_index              binary       -0.891 
#>  9 bal_accuracy         binary        0.0545
#> 10 detection_prevalence binary        0.493 
#> 11 precision            binary        0.0602
#> 12 recall               binary        0.0580
#> 13 f_meas               binary        0.0591
```

Or across thresholds as in weighted AUC or ROC curve or precision-recall curves?

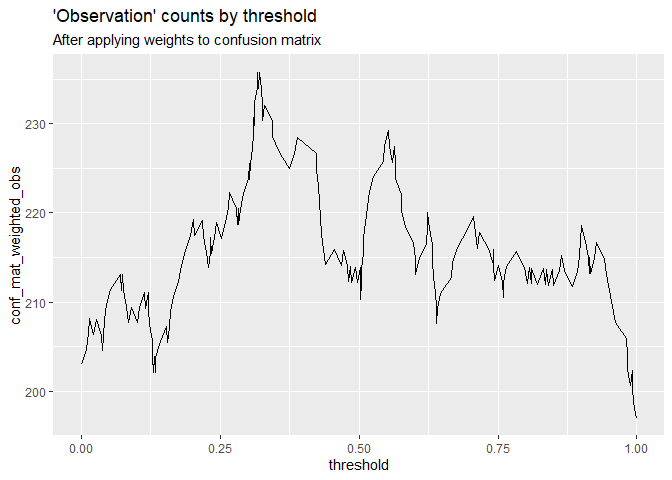
Does the fact that the sum of the cells of the confusion matrix is different from the observation count make these weighted metrics inappropriate (and also that the sum of cell counts can change depending on the decision threshold)?

For example in the unweighted example we have a sum across cells of 200 (the number of observations) whereas in the second case we have 207. The number of 'weighted' observations hence will vary between decision thresholds (shown below):

```r
weight_cells <- function(confusion_matrix, weights = matrix(rep(1, 4), nrow = 2)){
  
  confusion_matrix_output <- confusion_matrix
  confusion_matrix_output$table <- confusion_matrix$table * weights
  confusion_matrix_output
}

conf_mat_threshold <- function(df_input = df, 
                               threshold = 0.5){
  hard_pred <- df_input %>%
    mutate(pred_class = pred_prob > threshold) %>% 
    mutate(across(contains("class"), factor, c("TRUE", "FALSE")))
  
  yardstick::conf_mat(hard_pred, class, pred_class)
}

thresholds <- tibble(threshold = c(0, unique(df$pred_prob), 1)) %>% 
  arrange(threshold)

conf_matrix_thresholds <- thresholds %>% 
  mutate(conf_mat = map(threshold, conf_mat_threshold, df_input = df)) %>% 
  mutate(conf_mat_weighted = map(conf_mat, weight_cells, weights = outcome_weights))

conf_matrix_thresholds %>% 
  mutate(obs = map_dbl(conf_mat_weighted, ~sum(.x$table))) %>%
  mutate(across(contains("conf"), list(obs = ~map_dbl(.x, ~sum(.x$table))))) %>% 
  ggplot(aes(x = threshold, y = conf_mat_weighted_obs))+
  geom_line()+
  labs(title = "'Observation' counts by threshold",
       subtitle = "After applying weights to confusion matrix")
```
$\endgroup$
4
  • $\begingroup$ I don't think there's anything fundamentally disallowed in weighting every cell of the confusion matrix, but it's not clear to me why you'd want to associate a cost with a correct classification. Some of these metrics seem semantically incompatible with non-zero weights for correct classifications - it strikes me as very odd that you could classify two different datasets with no errors whatsoever, but get different values for accuracy solely due to differences in class prevalence. $\endgroup$ Commented Dec 8, 2020 at 15:50
  • $\begingroup$ I'm not viewing the correct classifications as having a cost but as having a gain. For instance if you are calculating net value, the diagonal elements would be positive and the off-diagonal elements would be negative (e.g. the 2nd example above would have a net value of -173). This may make sense when considering cases where correctly classified items bring in gains and incorrectly classified bring in losses, but these differ depending on the class (so are thinking about value rather than just costs). $\endgroup$ Commented Dec 8, 2020 at 16:56
  • $\begingroup$ I feel like all those metrics that look at a single table for a single cutoff probability wouldn't be ideal for a weighted scenario where you'd want to choose your cutoff probability to optimize value. you'd still want a high ROC model in the traditional sense (it should do a good job of sorting out the target) but you'd likely compare the models on the overall expected value they'd provide. I'm not convinced this achieves that goal. $\endgroup$
    – ShainaR
    Commented Dec 9, 2020 at 18:06
  • $\begingroup$ I am also interested in performance across cutoffs (edited the question to make that more explicit). I am unsure however if something like a weighted AUC would make sense in some contexts...? Just posted an initial answer suggesting it would not. So would you say then that if you are the point where you are weighting the confusion matrices (to identify an optimal cutoff) you should primarily be focusing on expected value at this point...? (AUC and general performance measures would have been in earlier stages for model evaluation/selection and probably don't want to weight those in this way). $\endgroup$ Commented Dec 10, 2020 at 23:33

2 Answers 2

3
$\begingroup$

Differential costs and benefits of class assignments are part of the reason why measures like accuracy are considered poor ways to assess models. If you have a well-calibrated model of class probabilities, the cost issues that you raise in this two-class scenario reduce to a simple choice of a cost-based probability cutoff for class assignment.

Let's say the cost of assigning a case to class $i$ when it's actually in class $j$ is $c_{i|j}$. Thus you can assign costs for correct classifications, and those "costs" could be negative (representing a gain).

Start with a simple situation: classes labeled $1$ and $2$, and no cost for correct classification. (That means values of 0 along the diagonal of your cost matrix.) Say that the estimated probability for assignment of a case with predictor values $x$ to class $1$ is $\hat p_1(x)$. Then with only $c_{1|2}$ and $c_{2|1}$ to consider as costs, to minimize cost you need to determine which of the expected costs, $c_{2|1}\hat p_1(x) $ or $ c_{1|2}(1-\hat p_1(x))$ is lower. Those costs are equal when:

$$ \hat p_1(x) = \frac{c_{1|2}}{c_{1|2}+c_{2|1}},$$

providing a cost-adjusted decision threshold.

For the two-class setting and non-zero (potentially negative) costs for correct assignments, the same argument provides a threshold of:

$$ \hat p_1(x) = \frac{(c_{1|2}-c_{2|2})}{(c_{1|2}-c_{2|2})+(c_{2|1}-c_{1|1})},$$

Notice that has the same form as for the simpler case without costs for correct classifications. So you can just re-define the misclassification cost as the difference in cost between incorrect and correct class assignment given the true class membership, set the cost of correct classification to 0, and get the same cost-based decision threshold. That's probably why you always see values of 0 along the diagonal of two-class cost matrices; from the decision-threshold perspective, you can always redefine the costs to achieve that.

Things are more complicated in multi-class situations, as explained by O'Brien, Gupta and Gray in Proceedings of the 25th International Conference on Machine Learning, Helsinki, Finland, 2008. The above is based on their presentation of the two-class case.

On this site you will see much emphasis on well-calibrated models and proper scoring rules instead of the measures that you report for your model. Rather than trying to figure out ways to adjust your measures to represent differential costs and benefits, it's simpler to get the probability model right first and take the costs/benefits into account at the ultimate class-assignment step. That said, there is a whole universe of potential proper scoring rules. If you already have a sense of the relative costs and benefits, you can choose a proper scoring rule that emphasizes probabilities near those of the cutoff you will ultimately use. Yi Shen describes this approach in his 2005 University of Pennsylvania thesis; this answer discusses that and related approaches like targeted maximum-likelihood.

$\endgroup$
2
$\begingroup$

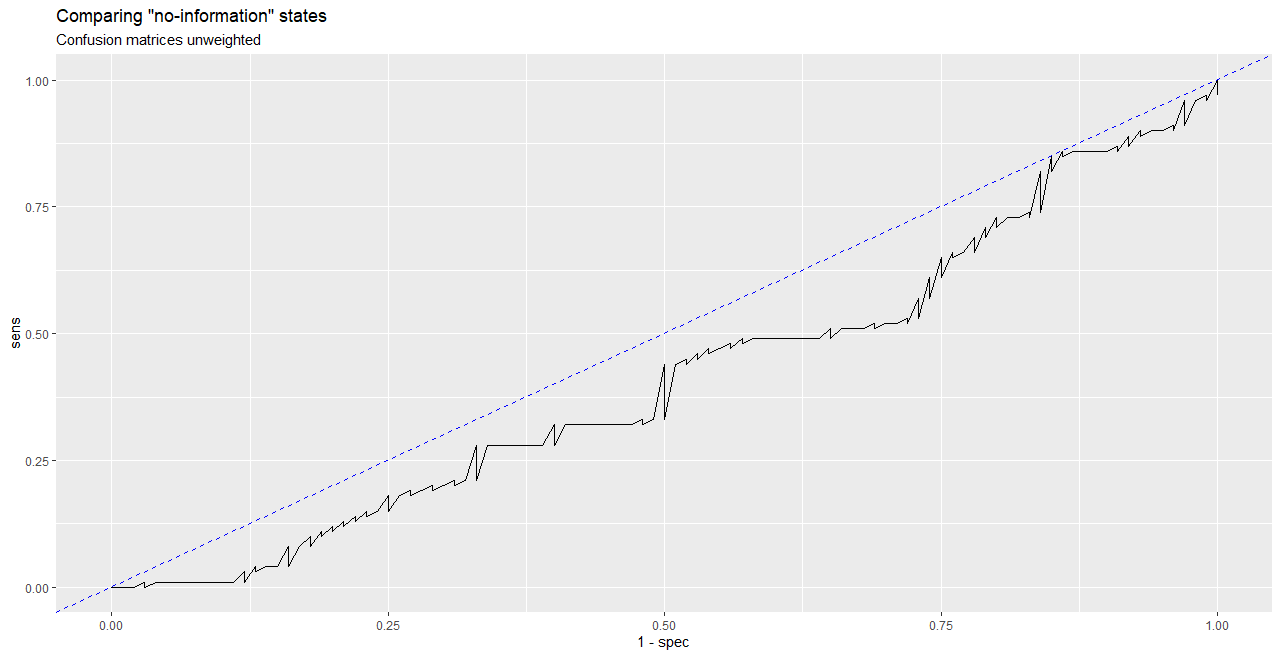
A problem with weighting these metrics is that they are typically interpreted against "no-information" models. For example AUC is the probability an (actual) positive case gets a higher prediction than a negative case, which (assuming no information in the model) is generally 0.5. The "no information" state for the precision recall curve is defined by the level of class imbalance (resource).

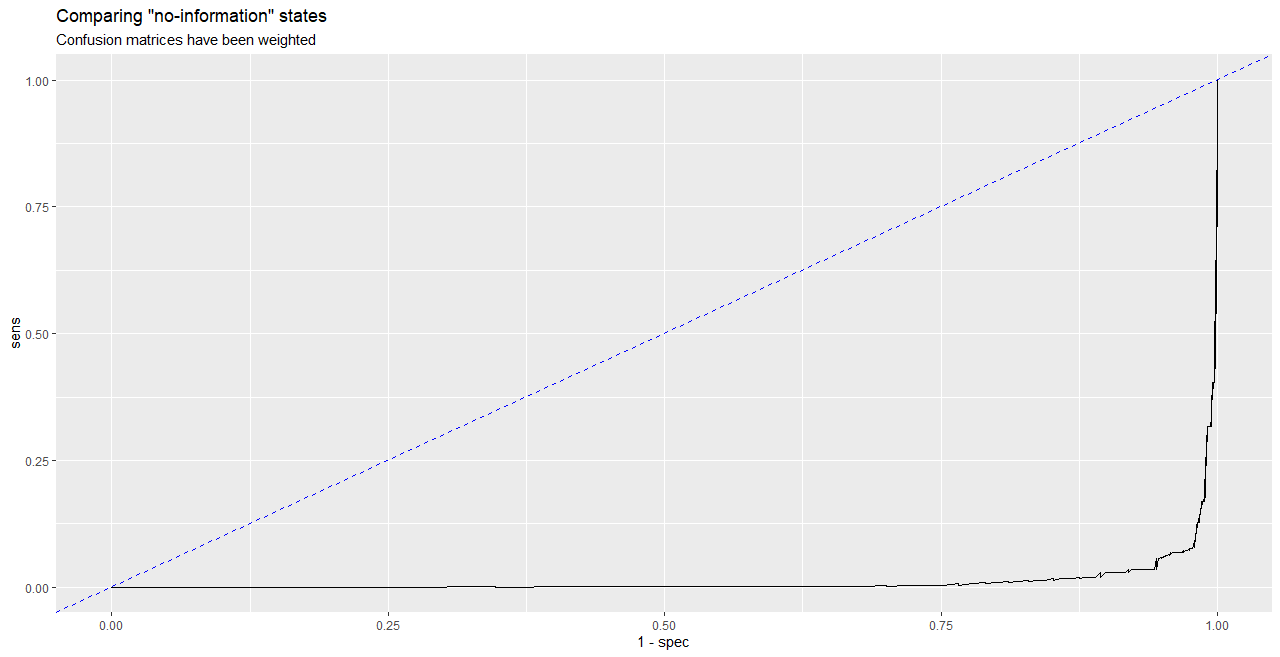
Hence, when the cells of the confusion matrix are being weighted these baseline comparisons will fluctuate with the decision threshold. This makes interpretations unintuitive and therefore the weighted metrics not particularly useful.

As an example, let's plot the ROC curve from the original question. The predictions were random so we would expect them to align (roughly) with the theoretical line of no information (the blue dashed line). In the unweighted case, we roughly see this:

```{r}
# See code in Original Question for how conf_matrix_thresholds is generated
conf_matrix_summary <- conf_matrix_thresholds %>% 
  mutate(across(contains("conf"), list(metrics = ~map(.x, summary))))

conf_matrix_summary %>%
  select(threshold, conf_mat_metrics) %>% 
  unnest() %>% 
  filter(.metric %in% c("sens", "spec")) %>% 
  spread(.metric, .estimate) %>% 
  ggplot(aes(x = 1 - spec, y = sens))+
  geom_line()+
  geom_abline(slope = 1, colour = "blue", linetype = "dashed")+
  labs(title = "'Observation' counts by threshold",
       subtitle = "After applying weights to confusion matrix")
```

enter image description here

However after weighting, we see these no longer line-up.

```{r}
conf_matrix_summary %>%
  select(threshold, conf_mat_weighted_metrics) %>% 
  unnest() %>% 
  filter(.metric %in% c("sens", "spec")) %>% 
  spread(.metric, .estimate) %>% 
  ggplot(aes(x = 1 - spec, y = sens))+
  geom_line()+
  geom_abline(slope = 1, colour = "blue", linetype = "dashed")+
  labs(title = 'Comparing "no-information" states',
       subtitle = 'Confusion matrices have been weighted')
```

enter image description here

Making any interpretations difficult. (Similar critiques could be made against trying to weight other metrics commonly used to evaluate classification models.)

$\endgroup$

Your Answer

By clicking “Post Your Answer”, you agree to our terms of service and acknowledge you have read our privacy policy.

Not the answer you're looking for? Browse other questions tagged or ask your own question.