I would like to ask what criticism could be raised in the following case example: In this paper they test a way of detecting narrowing of the cervical canal on radiographs using a ratio of measurements. In the subjects studied they do have a CT-scan as "gold standard": it is well-established that a spinal canal measured on CT of $<12$ mm is diagnostic of narrowing ($1$ label in logistic regression).
Here is the stated aim of the study:
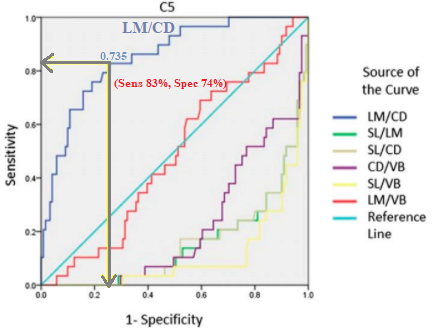
Ratios with significant correlation coefficients [with the CT measurement] were evaluated with receiver operating characteristic (ROC) curve analysis to define the cutoff ratio value that optimized the sensitivity and false-positive rate (1 - specificity) for indicating developmental cervical stenosis, which was defined as a sagittal canal diameter of <12 mm on CT.
with the following conclusion:
However, ROC curve analysis showed that only an LM/CD ratio [one of the methods of measuring the diameter on radiographs] of $\geq 0.735$ indicated a canal diameter of $<12$ mm (developmental cervical stenosis). [$<12$ mm is the agreed upon threshold on the "gold standard"].
- Is it methodologically correct to compare these different ratios of measurements of the spinal canal (LM/CD, SL/LM, etc) for accuracy using ROC's? Under what criteria is it OK in general?
- Is it correct to derive a cutoff point of $0.735$ from the ROC curves?
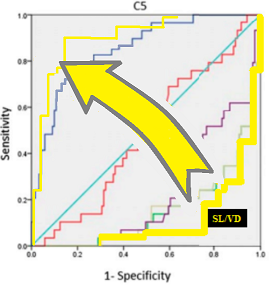
- And, much less important but curious, wouldn't SL/VB be just as good an (inverse) classifier as LM/CD, indicating a widely open spinal canal?
Regarding point (2) the use of ROC curves to establish thresholds in medicine is very problematic, and as explained in Scientific American, "Which threshold is optimal for a given population depends on such factors as the seriousness of the condition being diagnosed, the prevalence of the condition in a population, the availability of corrective measures for those who are diagnosed, and the financial, emotional and other costs of false alarms.".
Unfortunately, the paper is sparse in statistical details, but I presume the cutoff value indicated was chosen as to maximize the Youden's J statistic (lr.eta). Without positive evidence that this is the method that was used, it has problems because the cost ratio varies with prevalence, as in this article kindly shared by @Scortchi.
Regarding point (3) I wonder if this measurement should have somehow been inverted to place it back into the competition for the "best ratio" as a negative predictor, since "any classifier that produces a point in the lower right triangle can be negated to produce a point in the upper left triangle."
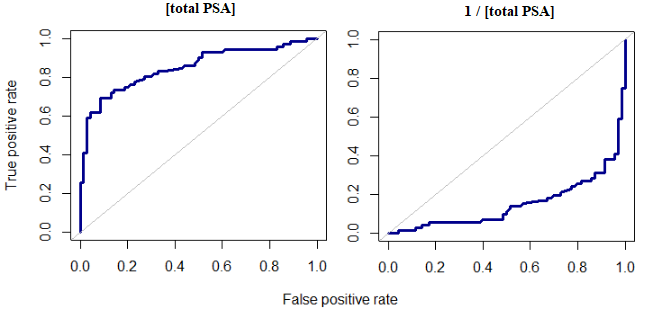
As an illustration, and using a PSA (prostatic specific antigen) dataset available for download here, the total PSA could be considered a good indicator of prostate cancer. The ROC plot exhibits a convex hull with an AUC of $0.85,$ and p-value of $<0.01$; however, just changing the sign (or inverting the value of the concentration of $\text{[PSA]}$ to $1/\text{[PSA]}$) resulted in a mirror image:
One may conclude that the ratios that predicted a large diameter of the canal (and therefore could act as good indicators as to the absence of canal stenosis) were not considered in the study, because no simple transformation was applied to for instance SL/VB (in yellow) to flip it onto the upper triangle:
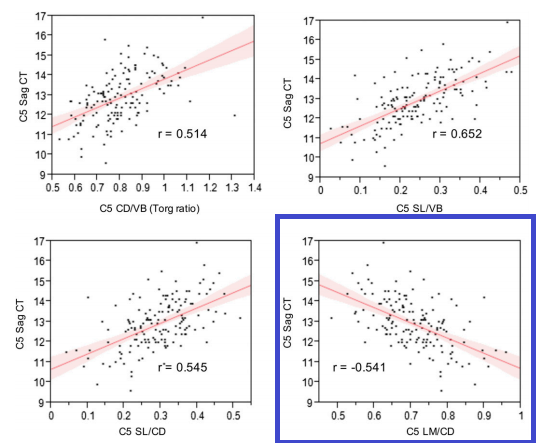
After @Carl's observation about the fact that the positive correlation of SL/VB with the canal diameter of $0.652$ does not jibe with the concave curve and low AUC, the point (3) is reinforced - they are throwing in the same bag and comparing measures of wide cervical canal (healthy) with a positive correlation together with a measure of narrow canal (disease) with the only negative correlation:
In general, the accuracy or performance of different diagnostic tests is ubiquitously analyzed in ROC curves, and the AUC's reported with or without CI's. Combinations of different classifiers are also often compared. This is such common practice that it is difficult for me to tell whether it is just something that is perhaps abused but not going away (as p values), and therefore not worth mentioning on peer-reviews, or a practice that is acceptable under some conditions that avoid the many criticisms that ROC curves have received, including AUC factoring in segments of little to no interest in the curve. In this regard, should the ROC curves be presented as supplemental, and avoid presenting "ROC analysis" as the method?


