The term "marginal" is very old. If you go back far enough in history, there were no scientific journals (evidently they started circa 1665). Instead, interim results were communicated via hand-written letters, and final results were written in books. There didn't tend to be much in the way of data graphics before Playfair, but books might often have tables with numbers under different conditions. Consider this table:
\begin{array}
\ &A &B &C &D \\
I &x_{I,A} &x_{I,B} &x_{I,C} &x_{I,D} \\
II &x_{II,A} &x_{II,B} &x_{II,C} &x_{II,D} \\
III &x_{III,A} &x_{III,B} &x_{III,C} &x_{III,D} \\
IV &x_{IV,A} &x_{IV,B} &x_{IV,C} &x_{IV,D} \\
\end{array}
These values are all conditional; that is, they give a number for a specific combination of conditions. However, sometimes readers wanted to know what a particular condition was like without regard for the other variable. Imagine $x_{I,A}$ is the number of times something happened when the first variable was $I$ and the second variable was $A$. Then, someone might want to know, how often did this happen when the first variable was $I$ no matter what the second variable was? It's easy to figure this out, you just sum up the $x$s in the first row and ignore the columns. People used to do this sort of thing commonly, and they (naturally) wrote the numbers in the margins of the book beside the table. Whereas the original numbers are conditional, there was no name for these other sorts of numbers; they became known as "marginal".
What do those numbers have to do with correlations? Well, it's not a direct connection, but once you have the idea of 'not taking account of other variables', and you have a name for that ("marginal"), when a new context arises that is analogous (i.e., correlations), the name and the idea are simply applied.
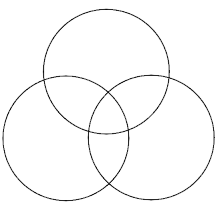
I don't know the etymology of partial correlations, but I can give you the intuition. It's rather straightforward, really: you are dealing with the correlation between part of one variable and part of another. Consider this figure:

We can imagine the left circle is a variable $X$, the right circle is a variable $Y$, and the top circle is a variable $Z$. The correlation between two variables is related to how much the circles overlap (in fact, we can imagine the area of the circles represents the variability of each variable and that the percentage of the area is $r^2$). Now it is clear that there is some correlation between $X$ and $Y$, but there is also some correlation between $X$ and $Z$, and between $Y$ and $Z$. What if you wanted to know what the correlation was between those parts of $X$ and $Y$ that were unrelated to $Z$? That would be the partial correlation. It is related to the overlap between the two parts of the circles that don't include the top slivers that intersect with the top circle.
I am fond of this webpage for providing an easy to understand discussion of partial correlations and related topics. Only the first section is about partial correlations per se, but I highly recommend reading the whole page (even though it's rather long). Although not directly related, the discussion at this thread: Where is the shared variance between all IVs in a linear multiple regression equation?, may be helpful as well.

