Can I use box-and-whisker plots also for multimodal distribution or only for unimodal distribution?
-
$\begingroup$ The usual term for a distribution with more than one mode would be 'multimodal'. If that's what you mean, please edit to use the usual term. If you mean something else, please define the term. $\endgroup$– Glen_bCommented Feb 16, 2015 at 21:48
-
1$\begingroup$ Box plots are not always helpful for complicated distribution shapes. Bimodal ... multimodal (I'd guess that to be a more common term than "polymodal") shapes will often be hidden. Much depends on how strong the departure from unimodality is. Otherwise no bell will ring and no error message will ensue. But even a histogram or kernel density estimate can mangle complicated distributions; some regard that as a feature as it's easy to be over-accepting of modes that are just quirks in a sample. I'd say that the only kind of plot that doesn't lose information is a quantile plot. $\endgroup$– Nick CoxCommented Feb 16, 2015 at 21:49
-
$\begingroup$ @Glen_b I did. In my book, they are speaking of polymodal distrubution. Is unimodal for one peak correct? $\endgroup$– user1091344Commented Feb 16, 2015 at 21:52
-
1$\begingroup$ You certainly can use a box-plot - who would stop you? The problem is that the usual boxplot gives no indication of the number of modes (though there are modifications of boxplots that can indicate multimodality). Boxplots are better when interest focuses on inter-group comparisons of location and spread (across many groups) rather than when distributional shape is of direct interest. If multimodality is important to show - especially if there are few groups - I'd strongly suggest using a different display, or perhaps several. (I'll expand my comment into an answer when I can.) $\endgroup$– Glen_bCommented Feb 16, 2015 at 21:57
-
1$\begingroup$ Your evidence doesn't incline us to think well of this book. $\endgroup$– Nick CoxCommented Feb 16, 2015 at 22:39
2 Answers
The problem is that the usual boxplot* generally can't give an indication of the number of modes. While in some (generally rare) circumstances it is possible to get a clear indication that the smallest number of modes exceeds 1, more usually a given boxplot is consistent with one or any larger number of modes.
* several modifications of the usual kinds of boxplot have been suggested which do more to indicate changes in density and cam be used to identify multiple modes, but I don't think those are the purpose of this question.
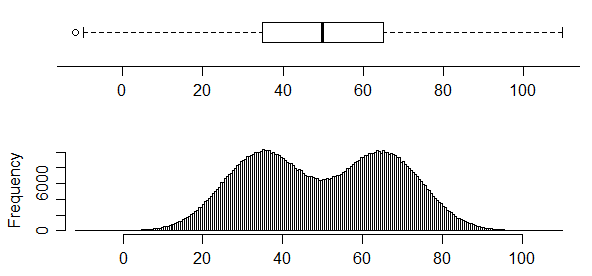
For example, while this plot does indicate the presence of at least two modes (the data were generated so as to have exactly two) -
$\qquad\qquad $ 
conversely, this one has two very clear modes in its distribution but you simply can't tell that from the boxplot at all:

Boxplots don't necessarily convey a lot of information about the distribution. In the absence of any marked points outside the whiskers, they contain only five values, and a five number summary doesn't pin down the distribution much. However, the first figure above shows a case where the cdf is sufficiently "pinned down" to essentially rule out a unimodal distribution (at least at the sample size of $n=$100) -- no unimodal cdf is consistent with the constraints on the cdf in that case, which require a relatively sharp rise in the first quarter, a flattening out to (on average) a small rate of increase in the middle half and then changing to another sharp rise in the last quarter.
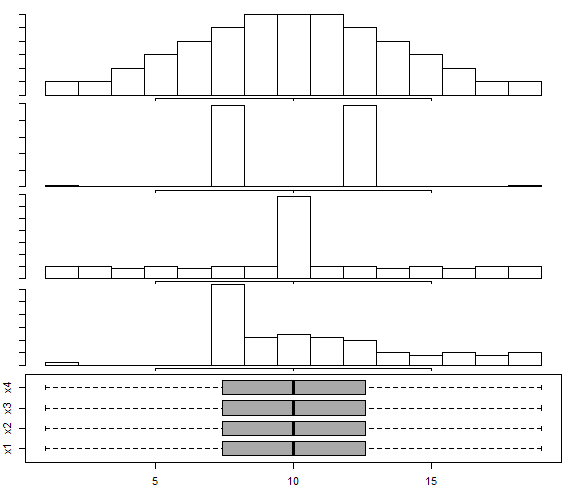
Indeed, we can see that the five-number summary doesn't tell us a great deal in general in figure 1 here (which I believe is a working paper later published in [1]) shows four different data sets with the same box plot.
I don't have that data to hand, but it's a trivial matter to make a similar data set - as indicated in the link above related to the five-number summary, we need only constrain our distributions to lie within the rectangular boxes that the five number summary restricts us to.
Here's R code which will generate similar data to that in the paper:
x1 = qnorm(ppoints(1:100,a=-.072377))
x1 = x1/diff(range(x1))*18+10
b = fivenum(x1)  # all of the data has this five number summary
x2 = qnorm(ppoints(1:48));x2=x2/diff(range(x2))*.6
x2 = c(b[1],x2+b[2],.31+b[2],b[4]-.31,x2+b[4],b[5])
d = .1183675; x3 = ((0:34)-34/2)/34*(9-d)+(5.5-d/2)
x3 = c(x3,rep(9.5,15),rep(10.5,15),20-x3)
x4 = c(1,rep(b[2],24),(0:49)/49*(b[4]-b[2])+b[2],(0:24)/24*(b[5]-b[4])+b[4])
Here's a similar display to that in the paper, of the above data (except I show all four boxplots here):

There's a somewhat similar set of displays in Matejka & Fitzmaurice (2017)[2], though they don't seem to have a very skewed example like x4 (they do have some mildly skewed examples) - and they do have some trimodal examples not in [1]; the basic point of the examples is the same.
Beware, however -- histograms can have problems, too; indeed, we see one of its problems here, because the distribution in the third "peaked" histogram is actually distinctly bimodal; the histogram bin width is simply too wide to show it. Further, as Nick Cox points out in comments, kernel density estimates may also affect the impression of the number of modes (sometimes smearing out modes ... or sometimes suggesting small modes where none exist in the original distribution). One must take care with interpretation of many common displays.
There are modifications of the boxplot that can better indicate multimodality (vase plots, violin plots and bean plots, among numerous others). In some situations they may be useful, but if I'm interested in finding modes I'll usually look at a different sort of display.
Boxplots are better when interest focuses on comparisons of location and spread (and often perhaps to skewness$^\dagger$) rather than the particulars of distributional shape. If multimodality is important to show, I'd suggest looking at displays that are better at showing that - the precise choice of display depends on what you most want it to show well.
$\dagger$ but not always - the fourth data set (x4) in the example data above shows that you can easily have a distinctly skewed distribution with a perfectly symmetric boxplot.
[1]: Choonpradub, C., & McNeil, D. (2005),
"Can the boxplot be improved?"
Songklanakarin J. Sci. Technol., 27:3, pp. 649-657.
http://www.jourlib.org/paper/2081800
pdf
[2]: Justin Matejka and George Fitzmaurice, (2017),
"Same Stats, Different Graphs: Generating Datasets with Varied Appearance and Identical Statistics through Simulated Annealing".
In Proceedings of the 2017 CHI Conference on Human Factors in Computing Systems (CHI '17). Association for Computing Machinery, New York, NY, USA, 1290–1294. DOI:https://doi.org/10.1145/3025453.3025912
(See the pdf here)
-
2$\begingroup$ Two broader comments on modes. 1. A good test of a particular pattern of modality is whether it repeatedly recurs in samples of the same size. My experience is that modes can be extremely fickle in that sense. 2. When considering modes it is always worth asking whether a mode has a substantive interpretation. But every argument can be wrong; if I recall correctly, most people would guess that a mix of males and females would impart bimodality to the distribution of heights, but it's hard to detect that even in high quality large samples. $\endgroup$– Nick CoxCommented Feb 17, 2015 at 0:18
-
1$\begingroup$ @NickCox thanks; actually, I'd have guessed heights wouldn't be bimodal; imagine that (as a rough approximation to reality) we considered two normal distributions with similar standard deviations, whose means differ by about 1sd, with about as many males as females. Then in fact the combined (mixture of two normals) distribution is unimodal. Reality is a little more complex, of course -both distributions are mixtures of ethnic groups, are skew even within sexes and ethnic groups, have different variances and the means differ by more than 1sd, but the result (unimodality) should not surprise us $\endgroup$– Glen_bCommented Feb 17, 2015 at 0:30
-
4$\begingroup$ It's worth flagging that J.W. Tukey in his Exploratory data analysis (Reading, MA: Addison-Wesley, 1977) included a dot plot of Rayleigh's data, which led to the discovery of argon, as a bimodal pattern for which box plots are useless and another display, in Tukey's case a dot plot, is needed to see the structure. Tukey as is well known named the box plot and is not so well known was its re-inventor. $\endgroup$– Nick CoxCommented Feb 17, 2015 at 9:19
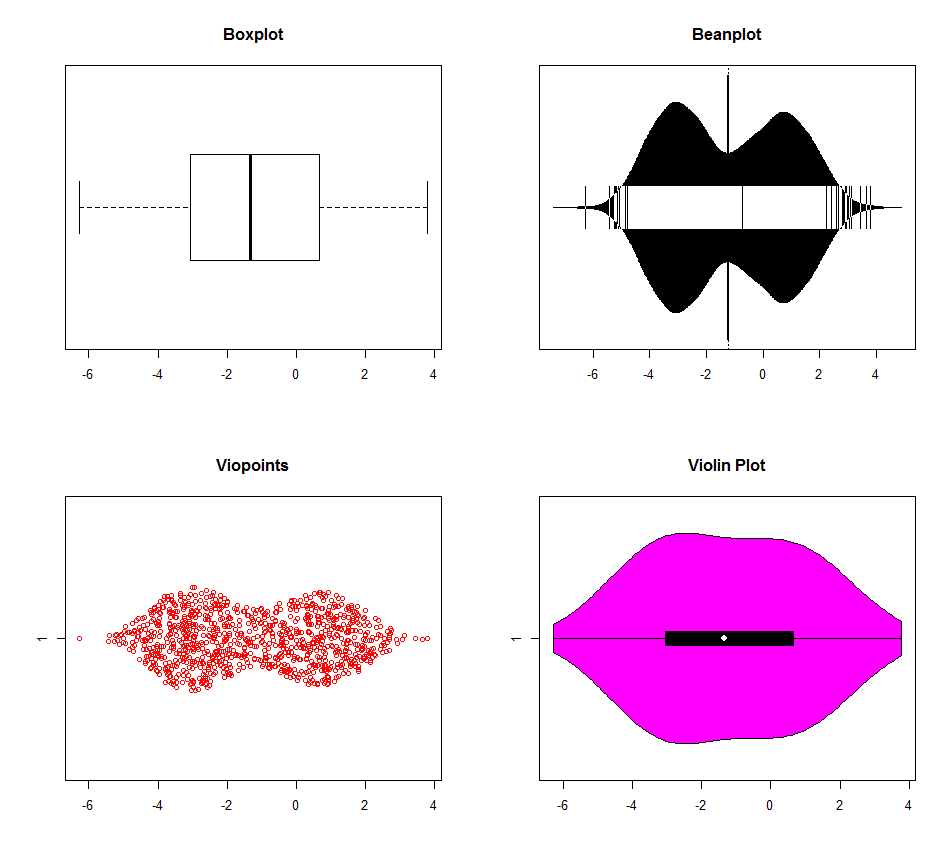
There are multiple options for detecting multimodality with R. Data for the below charts was generated with three modes (-3,0,1). The boxplot is clearly outperformed by the others (the violin plot looks like it has different default kernel density settings), but none really distinguish between the 0 and 1 modes. There are really few reasons to use boxplots anymore in the computer age. Why throw out information?

dat <- c(rnorm(500, -3, 1), rnorm(200, 0, 1), rnorm(300, 1, 1))

par(mfrow=c(2, 2))
boxplot(dat, horizontal=TRUE, main="Boxplot")

require(beanplot)
beanplot(dat, horizontal=TRUE, main="Beanplot")

require(viopoints)
viopoints(dat, horizontal=TRUE, main="Viopoints")

require(vioplot)
vioplot(dat, horizontal=TRUE)
title("Violin Plot")
