62
$\begingroup$

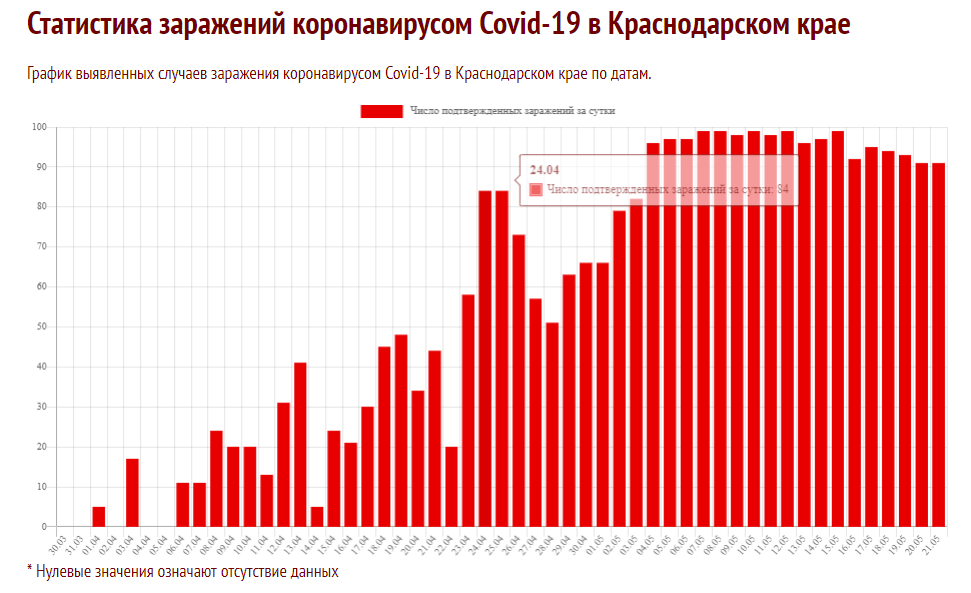
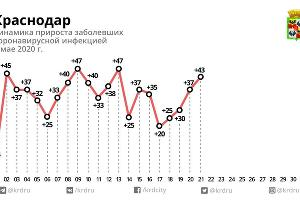
Below is a daily chart of newly-detected COVID infections in Krasnodar Krai, a region of Russia, from April 29 to May 19. The population of the region is 5.5 million people.

I read about it and wondered - does this (relatively smooth dynamics of new cases) look okay from the statistical standpoint? Or does this look suspicious? Can a curve be so level during an epidemic without any tinkering with the data by authorities of the region? In my home region, Sverdlovsk Oblast, for example, the chart is much more chaotic.

I'm an amateur in statistics, so maybe I'm wrong and this chart is nothing out of the ordinary.

enter image description here

According to a news report from 18 May 2020, a total of 136695 tests for COVID-19 had been made in the region since the start of the epidemic period and up to that day.

As of 21 May 2020, a total of 2974 infections have been recorded in the region.

P.S. Here's a link I found to a page with better-looking statistics, and covering a longer period, specifically for Krasnodar Krai. On that page, you can hover your cursor over the chart to get specific numbers for the day. (The title uses term "daily elicited" number of cases, and the bar caption "daily confirmed" number of cases):

enter image description here

$\endgroup$
19
  • 12
    $\begingroup$ @Tim, I asked CopperKettle to post this here. Even if I hadn't, I think there are meaningful statistical issues that can be discussed here, not just opinions. $\endgroup$ Commented May 21, 2020 at 12:42
  • 9
    $\begingroup$ The fuller red graph is telltale. However, just one note: the bars show the "number of confirmed cases" per day. Well, "confirmed" is not quite the same as "occured" or even "elicited", it is more mediated event than those. One of possible mediations can be some sort of unfair manipulation. But other variants are also possible, for example factors concerning availability and scheduling of virus diagnostic procedures. These factors could as well have changed between April and May in the region. As "confirmed" is less immediate than (approximately Poissonian) "emerged" it could affect the curve. $\endgroup$
    – ttnphns
    Commented May 21, 2020 at 14:58
  • 11
    $\begingroup$ Maybe they can only perform 100 tests a day? (This is somewhat in jest, as the proportion of confirmed cases would be too high. However, certain regions do have testing capacity constraints. That was the case even here in the San Francisco area.) $\endgroup$ Commented May 21, 2020 at 16:49
  • 3
    $\begingroup$ @steveo'america probably it will be more than 100 tests per day, or otherwise nearly all the tested people would have the virus, which you do not see elsewhere. Say, it could be 300 per day, and 1/3 of them are positive. In that case the mean of positive tests per day is 100 and the variance is 66.6 (and standard deviation about 8). That is one way how you can have the underdispersion but it is still not much different from the standard deviation of 10 for a Poisson distribution. Of course there can be more effects that cause underdispersion (e.g. the 'source' of patients is heterogeneous). $\endgroup$ Commented May 21, 2020 at 17:07
  • 3
    $\begingroup$ For interest - here is the Worldometers version of the data. $\endgroup$ Commented May 21, 2020 at 23:12

6 Answers 6

71
$\begingroup$

It is decidedly out of the ordinary.

The reason is that counts like these tend to have Poisson distributions. This implies their inherent variance equals the count. For counts near $100,$ that variance of $100$ means the standard deviations are nearly $10.$ Unless there is extreme serial correlation of the results (which is not biologically or medically plausible), this means the majority of individual values ought to deviate randomly from the underlying hypothesized "true" rate by up to $10$ (above and below) and, in an appreciable number of cases (around a third of them all) should deviate by more than that.

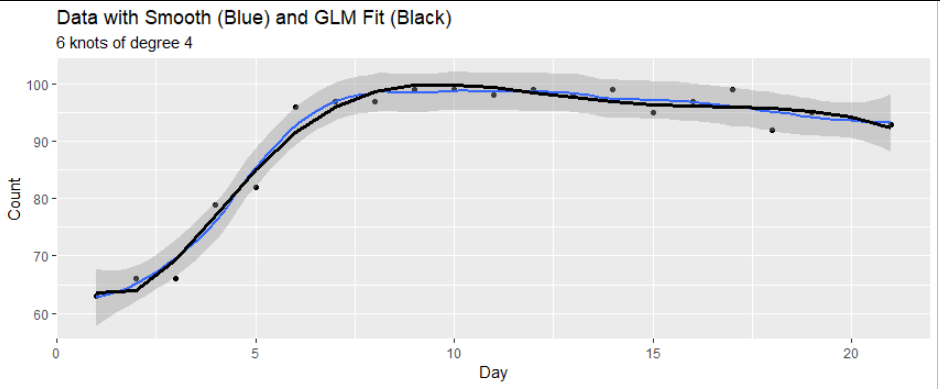
This is difficult to test in a truly robust manner, but one way would be to overfit the data, attempting to describe them very accurately, and see how large the residuals tend to be. Here, for instance, are two such fits, a lowess smooth and an overfit Poisson GLM:

Figure

The variance of the residuals for this Generalized Linear Model (GLM) fit (on a logit scale) is only $0.07.$ For other models with (visually) close fits the variance tends to be from $0.05$ to $0.10.$ This is too small.

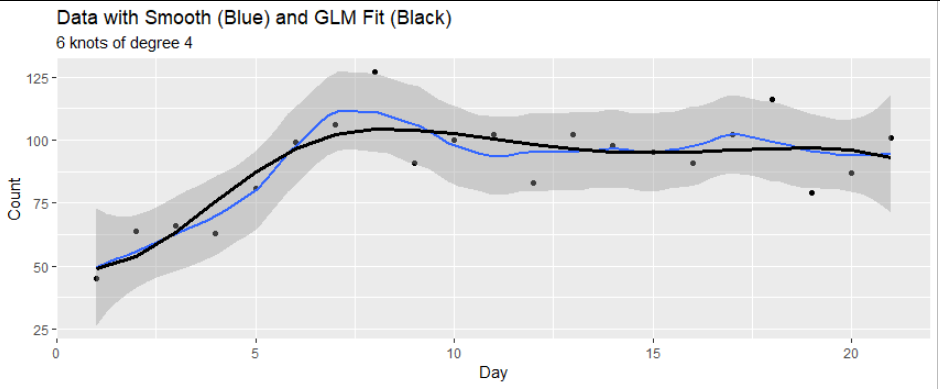
How can you know? Bootstrap it. I chose a parametric bootstrap in which the data are replaced by independent Poisson values drawn from distributions whose parameters equal the predicted values. Here is one such bootstrapped dataset:

Figure 2

You can see how much more the individual values fluctuate than before, and by how much.

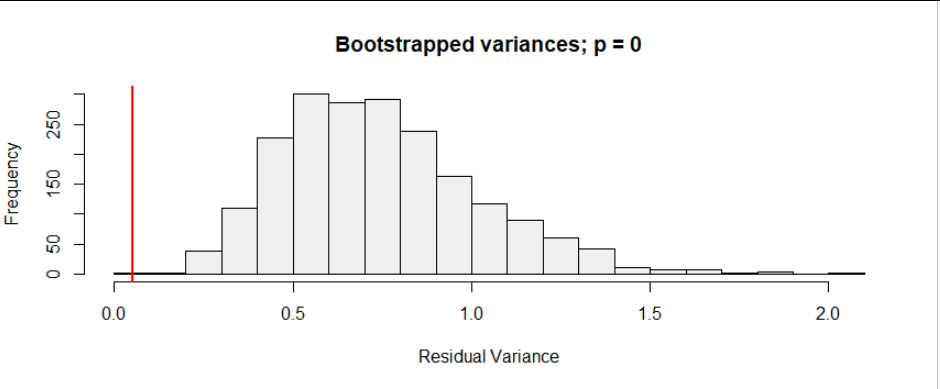
Doing this $2000$ times produced $2001$ variances (in two or three seconds of computation). Here is their histogram:

Figure 3

The vertical red line marks the value of the variance for the data.

(In a well-fit model, the mean of this histogram should be close to $1.$ The mean is $0.75,$ a little less than $1,$ giving an indication of the degree of overfitting.)

The p-value for this test is the fraction of those $2001$ variances that are equal to or less than the observed variance. Since every bootstrapped variance was larger, the p-value is only $1/2001,$ essentially zero.

I repeated this calculation for other models. In the R code below, the models vary according to the number of knots k and degree d of the spline. In every case the p-value remained at $1/2001.$

This confirms the suspicious look of the data. Indeed, if you hadn't stated that these are counts of cases, I would have guessed they were percentages of something. For percentages near $100$ the variation will be very much less than in this Poisson model and the data would not look so suspicious.


This is the code that produced the first and third figures. (A slight variant produced the second, replacing X by X0 at the beginning.)

y <- c(63, 66, 66, 79, 82, 96, 97, 97, 99, 99, 98, 99, 98, 
       99, 95, 97, 99, 92, 95, 94, 93)
X <- data.frame(x=seq_along(y), y=y)

library(splines)
k <- 6
d <- 4
form <- y ~ bs(x, knots=k, degree=d)
fit <- glm(form, data=X, family="poisson")
X$y.hat <- predict(fit, type="response")

library(ggplot2)
ggplot(X, aes(x,y)) + 
  geom_point() + 
  geom_smooth(span=0.4) + 
  geom_line(aes(x, y.hat), size=1.25) + 
  xlab("Day") + ylab("Count") + 
  ggtitle("Data with Smooth (Blue) and GLM Fit (Black)",
          paste(k, "knots of degree", d))

stat <- function(fit) var(residuals(fit))
X0 <- X
set.seed(17)
sim <- replicate(2e3, {
  X0$y <- rpois(nrow(X0), X0$y.hat)
  stat(glm(form, data=X0, family="poisson"))
})

z <- stat(fit)
p <- mean(c(1, sim <= z))
hist(c(z, sim), breaks=25, col="#f0f0f0",
     xlab = "Residual Variance", 
     main=paste("Bootstrapped variances; p =", round(p, log10(length(sim)))))
abline(v = z, col='Red', lwd=2)
$\endgroup$
15
  • 26
    $\begingroup$ Your answers are always exceptional. I love reading them because I love learning, and I learn a lot from you. Thank you. $\endgroup$ Commented May 21, 2020 at 13:25
  • 10
    $\begingroup$ You assume a Poisson distribution but are we really looking at counts from a Poisson process? Maybe the numbers are 'per thousand' and not counts or maybe they are a percentage or scaled such that a maximum equals hundred (like Google trend data)? Maybe the numbers are not from a Poisson process, and they relate to some limit of the process (e.g. lots of these data have gaps in the weekends when less data is processed)? The conclusion that these data are 'out of the extraordinary' depends on these assumptions. $\endgroup$ Commented May 21, 2020 at 14:24
  • 3
    $\begingroup$ @Sextus That's an interesting observation. I am indeed suspicious that the numbers might not be counts. But they're definitely not cases per thousand--that would sum to more cases than people! In any region in Russia, the total of a few thousand looks like it's the right order of magnitude. For these data to survive my analysis, they would have to represent counts at least three times larger than the raw numbers. (I worked this out simply by multiplying y by 3 in the code and re-running it, then doing that again with a multiple of 10.) $\endgroup$
    – whuber
    Commented May 21, 2020 at 14:30
  • 9
    $\begingroup$ BTW, my initial reaction was to focus on weekends because they exhibit no dips at all: that's an extraordinary departure from the reporting habits of many other countries. But, not wishing to speculate about such issues, and wishing not to become embroiled in finer details of time series analysis, I opted for the simpler exploratory approach I have outlined here. $\endgroup$
    – whuber
    Commented May 21, 2020 at 14:32
  • 2
    $\begingroup$ @COOL As I explained, there's nothing special about the model. What makes this analysis work is that when we vary the number of knots and degree of the splines, to adjust the degree of overfitting, the result stays the same. I have explored ranges of 2 through 12 for k and 3 through 6 for d. We could do the same by employing lowess models with varying degrees of tension as well as by many other regression models. $\endgroup$
    – whuber
    Commented May 21, 2020 at 14:55
27
$\begingroup$

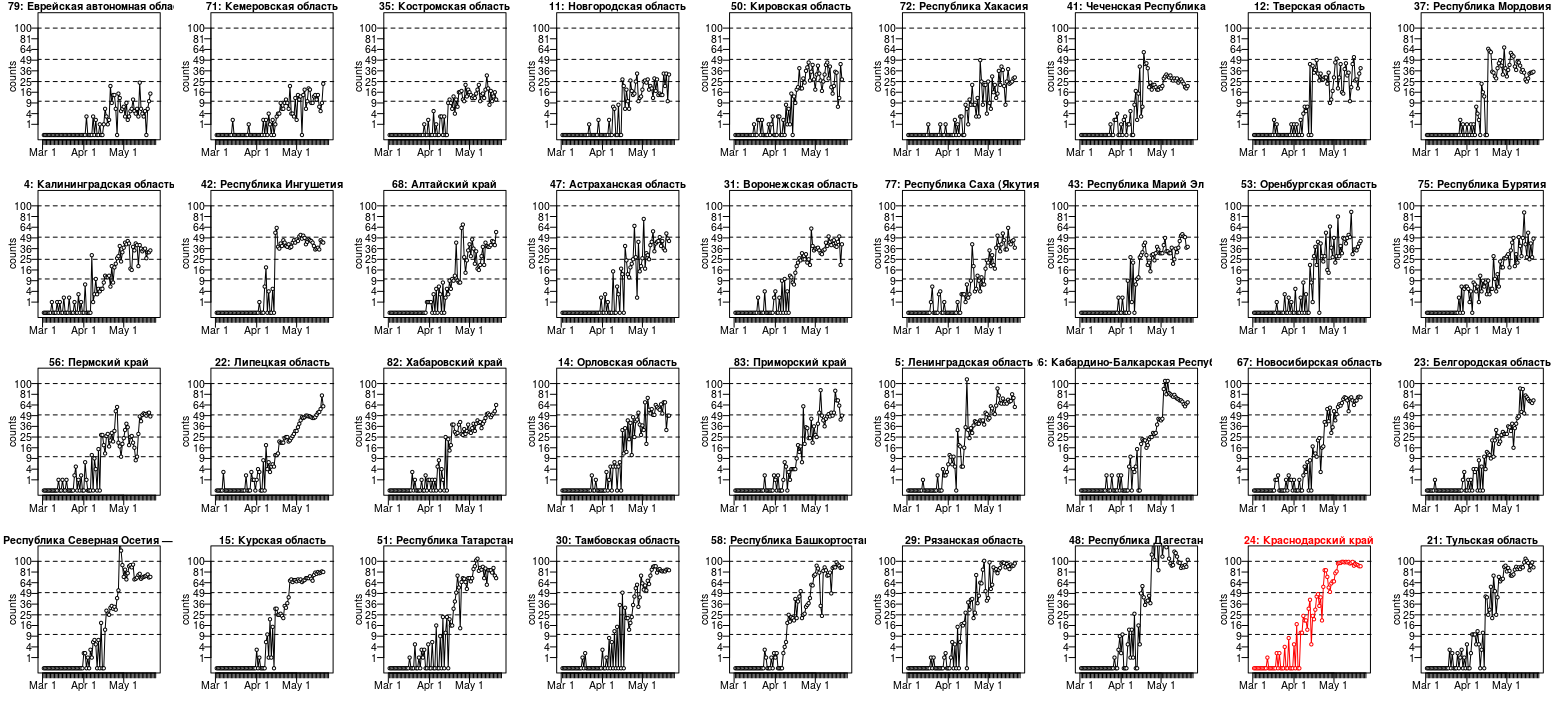
The Krasnodar Krai case is not the only one. Below is a plot for the data from 36 regions (I selected the best examples out of 84) where we either see

  • a similar underdispersion
  • or at least the numbers seem to be reaching a plateau around a 'nice' number (I have drawn lines at 10, 25, 50 and 100, where several regions find their plateau)
more cases

About the scale of this plot: It looks like a logarithmic scale for the y-axis, but it is not. It is a square root scale. I have done this such that a dispersion like for Poisson distributed data $\sigma^2 = \mu$ will look the same for all means. See also: Why is the square root transformation recommended for count data?

This data looks for some cases clearly underdispersed, if it would be Poisson distributed. (Whuber showed how to derive a significance value, but I guess that it already passes the inter-ocular trauma test. I still shared this plot because I found it interesting that there are cases without the underdispersion, but still they seem to stick to a plateau. There may be more to it than just underdispersion. Or there are cases like nr 15 and nr 22, lower left of the image, which show underdispersion, but not the fixed plateau value.).

The underdispersion is indeed odd. But, we do not know what sort of process has generated these numbers. It is probably not a natural process, and there are humans involved. For some reason, there seems some plateau or an upper limit. We can only guess what it could be (this data tells us not much about it and it is highly speculative to use it to guess what could be going on). It could be falsified data, but it could also be some intricate process that generates the data and has some upper limit (e.g. these data are reported/registered cases and possibly the reporting/registration is limited to some fixed number).

### using the following JSON file
### https://github.com/mediazona/data-corona-Russia/blob/master/data.json
library(rjson)
#data <- fromJSON(file = "~/Downloads/data.json")
data <- fromJSON(file = "https://raw.githubusercontent.com/mediazona/data-corona-Russia/master/data.json")

layout(matrix(1:36,4, byrow = TRUE))
par(mar = c(3,3,1,1), mgp = c(1.5,0.5,0))

## computing means and dispersion for last 9 days
means <- rep(0,84)
disp <- rep(0,84)
for (i in 1:84) {
  x <- c(-4:4)
  y <- data[[2]][[i]]$confirmed[73:81]
  means[i] <- mean(y)
  mod <- glm(y ~ x + I(x^2) + I(x^3), family = poisson(link = identity), start = c(2,0,0,0))
  disp[i] <- mod$deviance/mod$df.residual
}

### choosing some interresting cases and ordering them
cases <- c(4,5,11,12,14,15,21,22,23,24,
   26,29,30,31,34,35,37,41,
   42,43,47,48,50,51,53,56,
   58,67,68,71,72,75,77,79,82,83)
cases <- cases[order(means[cases])]

for (i in cases) {
  col = 1
  if (i == 24) {
    col = 2
    bg = "red"
  }
  plot(-100,-100, xlim = c(0,85), ylim = c(0,11), yaxt = "n", xaxt = "n", 
       xlab = "", ylab = "counts", col = col)
  axis(2, at = c(1:10), labels = c(1:10)^2, las = 2)
  axis(1, at = c(1:85), labels = rep("",85), tck = -0.04)
  axis(1, at = c(1,1+31,1+31+30)-1, labels = c("Mar 1", "Apr 1", "May 1"), tck = -0.08)


  for (lev in c(10,25,50,100)) {
    #polygon(c(-10,200,200,-10), sqrt(c(lev-sqrt(lev),lev-sqrt(lev),lev+sqrt(lev),lev+sqrt(lev))),
    #        col = "gray")
    lines(c(-10,200), sqrt(c(lev,lev)), lty = 2) 
  }
  lines(sqrt(data[[2]][[i]]$confirmed), col = col)
  points(sqrt(data[[2]][[i]]$confirmed), bg = "white", col = col, pch = 21, cex=0.7)
  title(paste0(i,": ", data[[2]][[i]]$name), cex.main = 1, col.main = col)
}


### an interesting plot of under/overdispersion and mean of last 9 data points
### one might recognize a cluster with low deviance and mean just below 100
plot(means,disp, log= "xy",
     yaxt = "n", xaxt = "n")
axis(1,las=1,tck=-0.01,cex.axis=1,
     at=c(100*c(1:9),10*c(1:9),1*c(1:9)),labels=rep("",27))
axis(1,las=1,tck=-0.02,cex.axis=1,
     labels=c(1,10,100,1000), at=c(1,10,100,1000))
axis(2,las=1,tck=-0.01,cex.axis=1,
     at=c(10*c(1:9),1*c(1:9),0.1*c(1:9)),labels=rep("",27))
axis(2,las=1,tck=-0.02,cex.axis=1,
     labels=c(1,10,100,1000)/10, at=c(1,10,100,1000)/10)

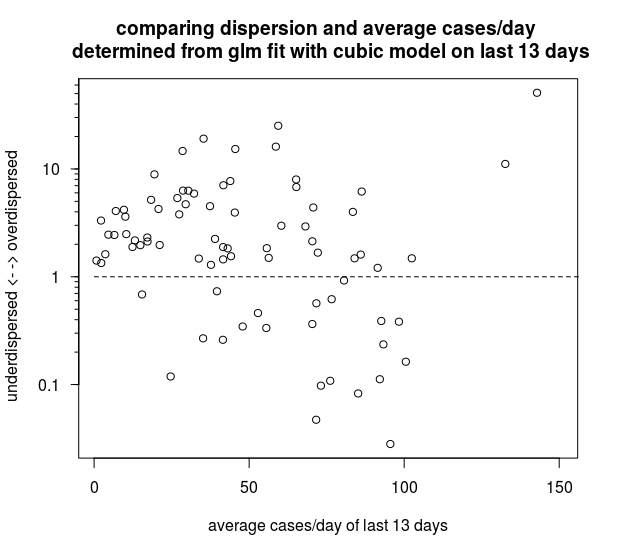
Maybe this is overinterpreting the data a bit, but anyway here is another interesting graph (also in the code above). The graph below compares all the 84 regions (except the largest three that do not fit on the plot) based on the mean value of the last 13 days and a dispersion-factor based on a GLM model with the Poisson family and a cubic fit. It looks like the cases with underdispersion are often close to 100 cases per day.

It seems to be that whatever is causing these suspiciously level values in Krasnodar Krai, it occurs in multiple regions, and it could be related to some boundary of 100 cases/day. Possibly there is some censoring occurring in the process that generates the data, and that limits the values to some upper limit. Whatever this process is that causes the censored data, it seems to occur in multiple regions in a similar way and has likely some artificial(human) cause (e.g. some sort of limitation of the laboratory testing in smaller regions).
comparing dispersion

$\endgroup$
10
  • 3
    $\begingroup$ Nice answer (+1). $\endgroup$
    – Ben
    Commented May 22, 2020 at 0:48
  • 4
    $\begingroup$ Good answer. I had wondered if there might be some selection bias - the data certainly looks very unusual, but with so many local statistics being tracked around the globe, it's expected that a small number of regions will have correct data that's statistically improbable due to chance alone, and it's easy to focus on those cases. But the consistent pattern of improbable results indicates this isn't a one-off instance due to chance. $\endgroup$ Commented May 22, 2020 at 14:15
  • 2
    $\begingroup$ @NuclearWang it is also interesting that these curves are showing that it is neither as if some single person is fabricating the data (I guess that this goes around in some people's minds). For this to be true the person that fabricated the data must have had a lot of imagination in making these different curves that all have the same behaviour, but everytime in a slightly different way. This does not look to me as if it is being fabricated by a single source. (My guess would be that the positive cases from regions undergo a second federal lab test, and this test is limited to 100/day) $\endgroup$ Commented May 22, 2020 at 14:39
  • $\begingroup$ Correlating cases to population could also be informative. A "boundary" around 100 looks suspicious, but to correct data this way all local authorities would need to correct their timeseries individually. It is hard job. And variance/mean seems individually shaped. I guess these is a combination of test inaccuracy, limited hospital beds, bias in sampling patient for testing, and maybe artificial (and less possible) case count underestimation. All of these were reported on TV and news officially, expect for last point. Moreover people say that number of cases is overestimated all around Russia. $\endgroup$ Commented May 22, 2020 at 15:59
  • 1
    $\begingroup$ @AlexeyBurnakov ” I guess these is a combination of test inaccuracy, limited hospital beds, bias in sampling patient for testing, and maybe artificial (and less possible) case count underestimation. " Certainly all these aspects are likely around. But I do not see how any of them are a cause for underdispersion (low noise). $\endgroup$ Commented May 22, 2020 at 16:13
24
$\begingroup$

I will just mention one aspect that I haven't seen mentioned in the other answers. The problem with any analysis that states that this is significantly out of the ordinary is that it doesn't take into account that the data have been selected based on looking strange. At least I'd assume that the thread opener has not only seen these data but also other data sets of similar type (maybe not even consciously, but in the media without noticing because they didn't seem any special - but I would expect somebody who writes a posting like this to have seen more consciously). The question to address is therefore not whether the data, seen as isolated, are significantly different from what could be expected, but rather whether, if everything's normal (not meant as in "normally distributed", you know what I mean), any data set like this or with a different pattern that would also prompt the thread opener to post here could be expected to be among all those they see. As we don't know what they have seen, that's pretty hard to assess, unless we come up with a p-value of $10^{-10}$ which would still be significant adjusting for almost any number of multiple tests.

Another way of testing this would be to make predictions for the future based on what the data show, and then test whether the strange trend goes on with observations that were not part of those that led to picking this data set.

Of course also the other answer that states that this kind of dodgy pattern also occurs in other regions can contribute some reassurance that something meaningful is going on because it isn't then such a special thing to pick. However the point I want to make is that for whatever analysis, selection bias should not be forgotten.

$\endgroup$
1
  • 6
    $\begingroup$ This is also related to the prosecutor's fallacy. An example of this from Dutch courts was my first introduction in Bayesian statistics. Also important is to keep in mind the data collection. Instead of mindlessly applying our equations, we should also carefully consider the process that generates the data. First look what is going one before applying the models. $\endgroup$ Commented May 22, 2020 at 12:20
18
$\begingroup$

Krasnodar

The data for a region is clearly not realistic in terms of its dispersion. Here's a data on Krasnodar town. The sample average is 34 in May, and the dispersion is 8.7.

enter image description here

This is more than Poisson distribution would suggest, where the dispersion is the square root of average, i.e. 5.9. This is overdispersed but the sample size is quite small so it's hard to simply reject Poisson distribution. The town has a population near 1M people.

However, when we jump into Kransodar krai with population of 5.5M, all of a sudden the dispersion collapses. In your plot the new cases average around 100, but the dispersion is 1-2. In Poisson you'd expect the dispersion of 10. Why would the capital be overdispersed but the whole region would be severy underdispersed? It doesnt make sense to me.

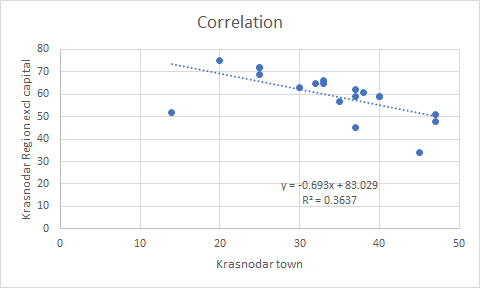
Also where did all the dispersion from the capital of the region go? "It's inconceivable!" (c) to think that the regional incidence is very strongly negatively correlated with its capital. Here's a scatter plot of the cases outside Krasnodar in the region vs Krasnodar town. enter image description here

Source

chart: source: https://www.yuga.ru/media/d7/69/photo_2020-05-21_10-54-10__cr75et3.jpg

scraped data: 14 45 37 37 32 25 33 40 47 40 33 38 47 25 37 35 20 25 30 37 43

Russia

@AlexeyBurnakov pulled the chart for entire Russia: enter image description here

I scraped the data for May, and it's severely overdispersed. The average is 10K but the variance is 756K, with dispersion 870 much higher than Poisson process would suggest. Hence, the overall Russia data supports my claim that Krasnodar Krai data is abnormal.

9623 10633 10581 10102 10559 11231 10699 10817 11012 11656 10899 10028 9974 10598 9200 9709 8926 9263 8764 8849 8894

Source

https://yandex.ru/covid19/stat?utm_source=main_title&geoId=225

$\endgroup$
2
  • 9
    $\begingroup$ Interesting analysis (+1), but it's not really inconceivable that you could get negative correlation. If some of the people showing signs of illness are transported to the capital for testing/treatment (or vice versa), that would induce negative correlation between the incidence in the two places, wouldn't it? (I'm not saying this is what is happening; just that there are "conceivable" possibilities that cound explain negative correlation here.) $\endgroup$
    – Ben
    Commented May 22, 2020 at 2:07
  • $\begingroup$ I find this an interesting approach and wonder whether the Moscow suburbs region (~1000 cases/day) may have similar correlations. If I ever find time then I am gonna scrape the data google.com/search?q="Балашиха"+covid+site:https://… and perform pca to find correlations and see whether sub regions add up to a multiple of 100. $\endgroup$ Commented May 22, 2020 at 2:11
12
$\begingroup$

So I think these are the data:

 month day new delta tens ones
     4  29  63    NA    6    3
     4  30  66     3    6    6
     5   1  65    -1    6    5
     5   2  79    14    7    9
     5   3  82     3    8    2
     5   4  96    14    9    6
     5   5  97     1    9    7
     5   6  97     0    9    7
     5   7  99     2    9    9
     5   8  99     0    9    9
     5   9  98    -1    9    8
     5  10  99     1    9    9
     5  11  98    -1    9    8
     5  12  99     1    9    9
     5  13  96    -3    9    6
     5  14  97     1    9    7
     5  15  99     2    9    9
     5  16  92    -7    9    2
     5  17  95     3    9    5
     5  18  94    -1    9    4
     5  19  93    -1    9    3

One of the fun, introductory, elements of forensic accounting is Benford's law.

When I look at the frequencies of the ones-digits and the tens digits I get this:

 Ones count rate
    1     0  0.0
    2     2  9.5
    3     2  9.5
    4     1  4.8
    5     2  9.5
    6     3 14.3
    7     3 14.3
    8     2  9.5
    9     6 28.6

 Tens count rate
    1     0  0.0
    2     0  0.0
    3     0  0.0
    4     0  0.0
    5     0  0.0
    6     3 14.3
    7     1  4.8
    8     1  4.8
    9    16 76.2

I notice a very strong preponderance of "6" and "9" in the data.

If the ones-place (second) digits were distributed according to Benford's rules they should happen something near 9.7% and 8.5% of the time, respectively, instead of better than 20% of the time.

$\endgroup$
6
  • 23
    $\begingroup$ Thinking of Benford's Law is good, but it's not applicable. The reason is that Benford's Law can be expected to hold only when data range over several orders of magnitude. Here, their initial digits obviously will be concentrated around 9 and 1 even when the data reflect honest reporting of values that tend to lie between 90 and 199. Thus, Benford's Law (by itself) is useless for distinguishing honest data from fake data in this example. $\endgroup$
    – whuber
    Commented May 21, 2020 at 13:33
  • 2
    $\begingroup$ If this is how Benford's Law worked, then you could show that any dataset with a small standard deviation is fake by displaying it in an (un)appropriately large base. $\endgroup$ Commented May 21, 2020 at 22:46
  • 1
    $\begingroup$ @BlueRaja-DannyPflughoeft , If I wanted to be (much less) hand-waving then I would use the sample size to make some decent bounds. Right now I have a mean, and half the time you are above it and half below it: mean target can be much worse for career than 95% CI window. $\endgroup$ Commented May 22, 2020 at 10:25
  • 2
    $\begingroup$ @Bob The problem with that reasoning is that if the true rate during this period were close to 100, about a third of the time we would see counts in the 90's and half the time we would see them in the 100's, so observing a preponderance of 9's and 1's among initial digits does not discriminate random, independent behavior from behavior that looks unusual or suspicious. Benford's Law is neither applicable nor useful in this circumstance. $\endgroup$
    – whuber
    Commented May 24, 2020 at 16:48
  • 2
    $\begingroup$ The criticism of the 'tens' is a fair point but EngrStudent is also showing that there is a discrepancy in the 'ones' (where it is also missing the zero value which makes the discrepancy larger). However, for the ones the 'problem' is that the test is not very powerfull for these smalls numbers (with large variance) a chisquare test only gives a p value around 0.17 so it is not so special to see these discrepancies. Example: run the following R-code chisq.test(c(0,0,2,2,1,2,3,3,2,6)) $\endgroup$ Commented May 25, 2020 at 8:39
5
$\begingroup$

Interesting points from everyone. Let me contradict some.

1) Why Poisson? Cases generation process is intristically interdependent as a pandemic interaction between ill and healthy, so case occurence in a time interval maybe affected by the previous interval occurences. The dependency may be complicated but strong.

UDPATE (as of May 23rd)

1.1) Imagine the physics of the process.

  • a) A person is healthy ->
  • b) They get infected from a covid-positive one ->
  • c) they fill sick and go to a hospital ->
  • d) they get screened after - and very likely - waiting in line, or time table slot ->
  • e) the lab processes tests and determines new positives ->
  • f) a report goes to a ministry and gets summarized for a daily report.

I would like to insist again, after long discussion and downvotings I got, that when you see the stage F reports, you should understand that events occurred as a function of a lot of human interactions, and it is important they were accumulated to pass a "bottleneck" of either: their own time to visit a doctor, the doctor appointment time table, or laboratory test processing limits. All of these make it non-Poissonian, as we don't use the Poisson for events that wait in a line. I think that it is mostly about lab tests that are made by humans who work with average capacity and cannot process too many per day. It is also possible that the final reporting stage accumulates information in a sort of buckets.

My point is that it is not Poisson, or generalization. It is the "Poisson with waiting in line and data accumulation in time periods". I don't see 100% evidence of "Soviet-style data manipulations". It could be just bulks of pre-processed data up to report.

2) For the Krasnodar region the daily mean seems to be non-stationary. It is not good at all to approach these data from Poisson view, or at least one should take only the stationary part of it.

These points are about 2 major Possion distribution assumptions violations.

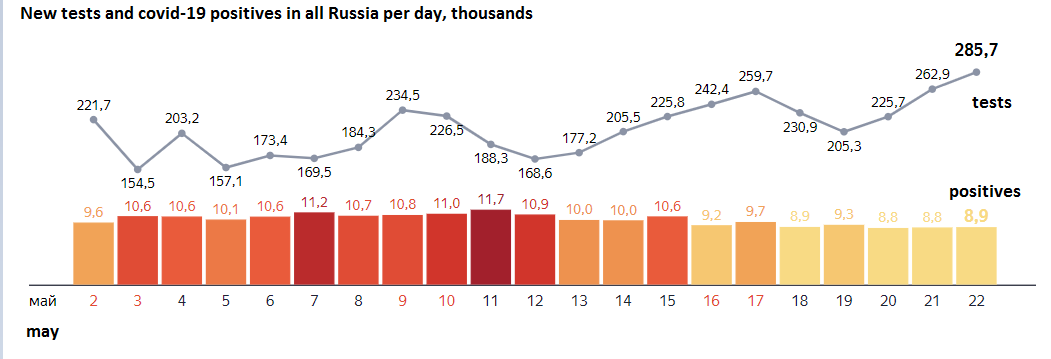
3) Why 100 tests per day? It is official information that in Russia (and I am in Russia, reading news constantly) there were 7.5 million tests made so far, and about 330,000 cases confirmed (as of May 22nd). The proportion of positives is less than 5%. With this, you should expect at least 2,000 tests per day allowed. This could be real, as the tests are scarce and expensive items and not only in the Krasnodar, Russia, or Europe. It is everywhere the same. @Aksakal

enter image description here

(source: https://yandex.ru/covid19/stat?utm_source=main_title&geoId=225)

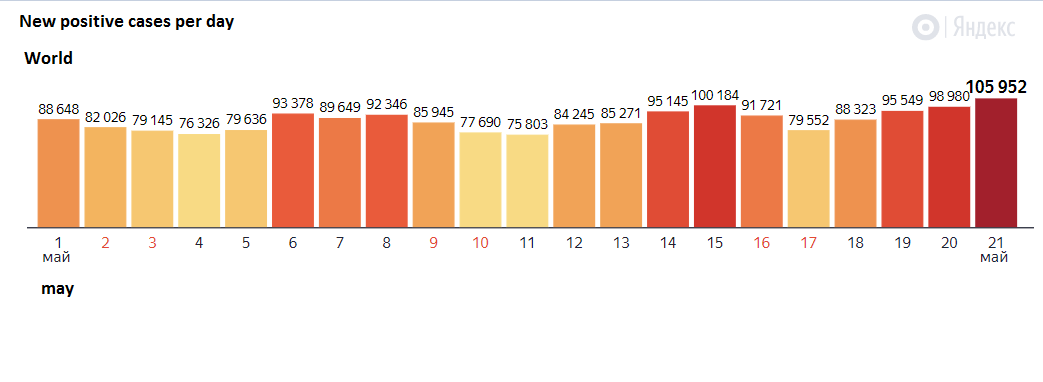
4) Why ever would you think these are "Soviet data"? Look at the World data for new covid cases. It is extremely low-variance if you think it must be Poisson (a sum of Poissons is a Poisson). Is the World "Soviet" (I guess you mean lying?) then? @Ben - Reinstate Monica

enter image description here

(source: https://yandex.ru/covid19/stat?utm_source=main_title&geoId=225)

So, it seems to me that Statistics application in the case of pandemic is a dangerous thing. Lots of assumptions of all kinds must be true to conclude what have been concluded.

UPDATE

To address the point about the world data under/overdispersion,

library(data.table)
library(magrittr)

dat <- read.csv(url('https://covid.ourworldindata.org/data/owid-covid-data.csv'))

setDT(dat)

dt <- 
    dat[location == 'World', sum(new_cases), date] %>%
    .[, date:= as.Date(date)] %>% 
    .[date >= '2020-04-01'] %>% 
    setorder(date)

min(dt$V1)

max(dt$V1)

mean(dt$V1)

var(dt$V1)

var(dt$V1) / mean(dt$V1) # huge overdispersion, indeed

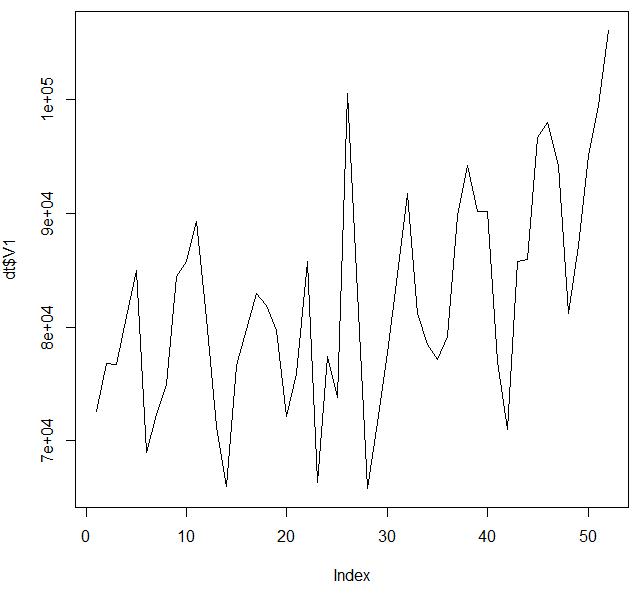
plot(dt$V1,type='l')

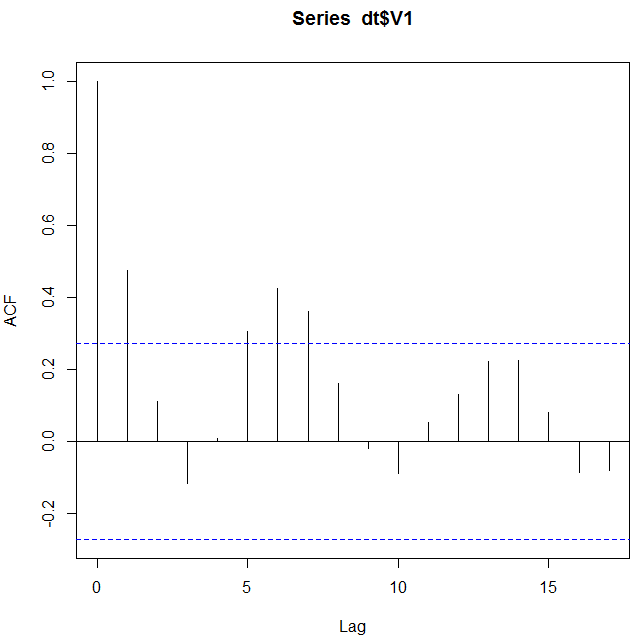
acf(dt$V1)

I got data for April, 1st till today (as a more stationary, plateu phase).

enter image description here

The calculation showed that variance to dispersion ratio is 1083. This is huge overdispersion. My naked-eye analysis was wrong.

There is significant weekly autocorrelation present.

enter image description here

This can be one of the reasons for higher variance, but is it enough? And why is there a daily pattern? Is it still the Poisson process or lying statistics worldwide?

$\endgroup$
46
  • 6
    $\begingroup$ The point is that the data is under-dispersed. Even despite your point (1) and (2) one should expect that the variance of the noise in the data should be close to the mean of the data (or larger/overdispersed). This is also obvious from the plot of the curves where we see the odd drastic decrease in noise in May. (3) "With this, you should expect at least 2,000 tests per day allowed" what do you mean by that? (4) The world data has no low variance. It ranges from 80k to 100k. So roughly a coefficient of variation of some 10%. That is overdispersion not underdispersion. $\endgroup$ Commented May 22, 2020 at 10:46
  • 2
    $\begingroup$ 1) and 2). I don't see why underdispersion should be mentioned if you are not sure these are Poisson data. That was the point. 3) I mean there are on average 5 out of 100 people who were covid-positives after taking tests, so 100 positives mean 100 * 20 tests on average... That can really be a huge number of tests for a small region like Krasnodar and the test number can be limited to 2000 by budget constraints of lack of medical workers. 4) Let me add some research to my answer, you may be right. $\endgroup$ Commented May 22, 2020 at 10:50
  • 2
    $\begingroup$ @EngrStudent, I would never like to see or get engaged in data politicizing on this website that I like. Not to mention that in the Soviet Union the statistics and economic science was very sophisticated. On your other two comments, intuitively, the data generation process is dependent, and data that I saw was always strange, non random. $\endgroup$ Commented May 22, 2020 at 11:09
  • 6
    $\begingroup$ Why Poisson? Cases generation process is intristically interdependent as a pandemic interaction between ill and healthy – Sure, the Poisson process is a rough assumption, but, when it comes to investigating underdispersion, it is a benign one. Most interdependency mechanisms such as superspreaders, weekends, weather would increase the dispersion in comparison to a Poisson process. I cannot think of any epidemiological mechanism that would decrease the dispersion. … $\endgroup$
    – Wrzlprmft
    Commented May 22, 2020 at 13:19
  • 4
    $\begingroup$ @SextusEmpiricus: My point is that there are plenty of mechanisms that explain overdispersion. This does not automatically invalidate the data. Of course, one should not get overexcited over a sudden jump from one day to the next, but when you account for such effects and look at a proper moving average, the data can still have some value. By contrast, all mechanisms leading to underdispersion I can think of also lead to completely useless data. $\endgroup$
    – Wrzlprmft
    Commented May 22, 2020 at 13:46

Not the answer you're looking for? Browse other questions tagged or ask your own question.