7
$\begingroup$

I have read these two questions Why are p-values uniformly distributed under the null hypothesis? and Understanding scipy Kolmogorov-Smirnov test

And this inspired me the following experiment.

I consider a number (100) of random samples of 10000 numbers each, drawn from the uniform distribution:

import numpy as np
from scipy.stats import kstest

np.random.seed(1)
data = np.random.rand(1e6).reshape(100, -1) # Retrieve 100 samples of 10000 random numbers
pvals = np.array([kstest(data[i, :], 'uniform')[1] for i in range(100)]) # Use KS test to determine the p-value that they are drawn from a uniform distribution

The p-values should be distributed uniformly between 0 and 1, because the null hypothesis that each sample is drawn from the uniform distribution is true. In the code, pvals contains the p-values, and should be distributed uniformly between 0 and 1. How do I test that they are distributed uniformly? Well, with another KS test on the p-values themselves. Indeed:

kstest(pvals, 'uniform') # gives (0.066826050153764194, 0.78391523133790764)

My question is: how bad should a sample fail its individual KS test, for the p-value distribution not to be uniform? That is, to cause the second KS test to fail as well? Let's inject a couple of failed tests, and see the results:

for i in range(100):
    pvals[i] = 1.e-1000000000000000000
    print(i+1, kstest(pvals, 'uniform'))

1 (0.076826050153764203, 0.58422275090933029)
2 (0.076826050153764203, 0.58422275090933029)
3 (0.086826050153764212, 0.41822788102030262)
4 (0.08849630728801916, 0.39396788117495984)
5 (0.098496307288019169, 0.26906188301811063)
6 (0.10849630728801915, 0.1764729585550886)
7 (0.11849630728801916, 0.11114480850529129)
8 (0.12849630728801917, 0.067209484059870706)
9 (0.13849630728801915, 0.039015977679199176)
10 (0.14849630728801916, 0.021740018916014403)
11 (0.15849630728801917, 0.011625520543988133)
[...]

This tells me that for the second KS test to acknowledge that the p-value distribution is not uniform with 0.99 confidence, I must inject 11 failed tests, each as bad as p-value = 1.e-1000000000000000000.

Intuitively however I expected that the probability of getting one out of 100 p-values less than or equal to 1.e-1000000000000000000 would be given by:

$\dfrac{100!}{1! 99!} p (1-p)^{99}$

Where $p = 10^{-1000000000000000000}$. This expression is of the order of 1.e-999999999999999998, or in layman terms (like I am) rather unlikely. Where is my intuition wrong?

$\endgroup$

1 Answer 1

8
$\begingroup$

The Kolmogorov Smirnov statistic uses a fairly generic measure of nonuniformity - it's not particularly sensitive to every way in which a distribution may be non-uniform. In particular, it's not especially sensitive to the particular kind of nonuniformity you're looking at.

The KS-test statistic looks at the maximum distance between cdf and ecdf.

to acknowledge that the p-value distribution is not uniform with 0.99 confidence

That's not how hypothesis tests work. You don't have "0.99 confidence". I presume you mean you're doing your test at $\alpha=0.01$.

At $n=100$, the $1\%$ critical value is $0.163$.

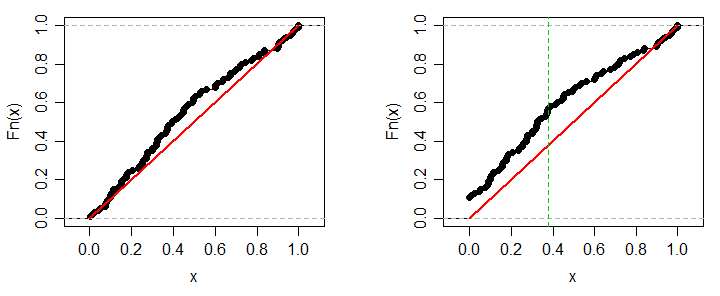
Each small value you put in moves the ecdf near 0 up by about 0.01 (and by about half that distance near 0.5 if the distribution is close to uniform). If the ecdf was previously very close to uniform you might expect it to take about 16 values to reach that critical value.

However, in practice it takes less than 16 because of the natural random variation in the rest of a typical sample; it wiggles about a uniform:

enter image description here

The left side is an ECDF of sample of 100 values from an actual uniform. There's some deviation in the center due to random variation, but nowhere near large enough to reach the 1% significance level. The right side is an ECDF of the same sample where in addition the first 11 values (not the smallest 11, just 11 values from the start of the sample) were replaced by exactly 0*. In this case that's more than enough to pass the 1% critical value of the statistic. (In this case, fewer than 11 would be sufficient, but typically it takes a little more than 11.)

*(which, given even a single instance of such a value, some other tests would identify non-normality without difficulty)

So if you want to make something that is close to uniform look non-uniform to a KS-test by inserting small values, you would need to insert a lot of them. If you want a test specifically sensitive to "too many very small values", there are a number of better choices than the KS test for that. The Anderson-Darling test would be an example of a test that's more sensitive to the specific kind of deviation you're constructing here.

$\endgroup$
0

Your Answer

By clicking “Post Your Answer”, you agree to our terms of service and acknowledge you have read our privacy policy.

Not the answer you're looking for? Browse other questions tagged or ask your own question.