0
$\begingroup$

I am working on an alogorithm in R to automatize a monthly forecast calculation. I am using, among others, the forecast(method='arima') function from the forecast package to calculate forecast. It is working very well. But for some times series some forecast are quite strange.

Please find below the code i'm using:

train_ts<- ts(values, frequency=12) fit1 <- stl(train_ts, s.window="periodic",t.window=24, ) arima <- forecast(fit1,h=forecasthorizon,method ='arima')

values <- c(27, 27, 7, 24, 39, 40, 24, 45, 36, 37, 31, 47, 16, 24, 6, 21, 35, 36, 21, 40, 32, 33, 27, 42, 14, 21, 5, 19, 31, 32, 19, 36, 29, 29, 24, 42, 15, 24, 21)

Here, on the graph, you will see the historical data (black), the fitted value (green) and the forecast(blue). The forecast is not in lines with the fitted value.
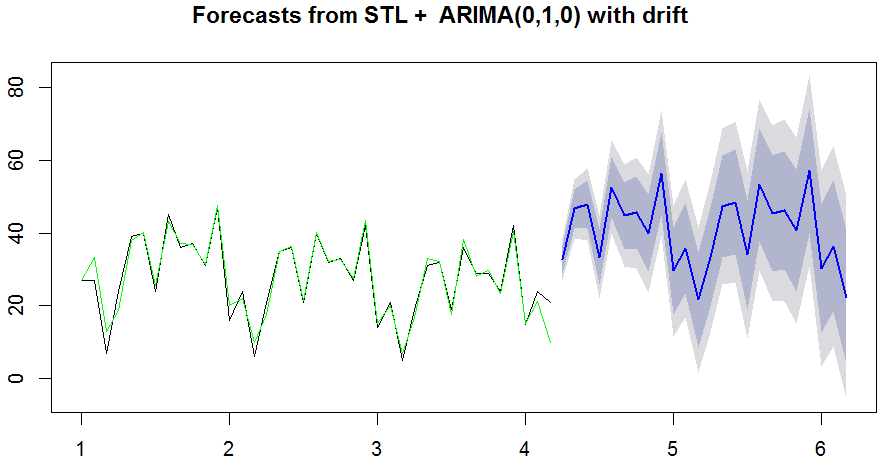
enter image description here As you can see the Forecast is not in line with the history, My question is "does a setup for Arima to bound the forecast in line with the history exist" ?

$\endgroup$
3
  • $\begingroup$ I know the origin of the problem, but can we constrain arima to be less sensitive to the last values and not having a level step up ? and if it's possible does any one know how to set it up ? $\endgroup$ Commented May 22, 2015 at 9:26
  • $\begingroup$ Since this problem arisies due to outliers, we need to Identify outliers, treat them using dummy coding or add regressors in arima framework, that is the ONLY way to solve the problem.Anything else would be treating the symptoms not the cause. $\endgroup$
    – forecaster
    Commented May 24, 2015 at 2:06
  • $\begingroup$ I totaly understand that, but in my case, i've seted up a program that will do the forecast for a lot of data, and it will be impossible to correct each time series. Does a way to parameter Arima to be less sensitive to the last values exist ? Or Bound it to avoid large step up or down ? $\endgroup$ Commented Jun 3, 2015 at 15:07

2 Answers 2

0
$\begingroup$

Try doing the following:

  1. Generate the ACF and PACF graphs for your data. They will give you your 'p' and 'q' values in the ARIMA model

  2. Check your data for non-stationarity and remove it using differencing (or any other technique). Calculate the 'd' value through this

  3. Check your data for seasonality. Use the 'decompose' function to get a break down of the various components in your data. If seasonality exists (as it does in many cases), use SARIMA instead of ARIMA

Steps (1) and (2) will help you generate a strictly ARIMA model whereas step (3) will build a new model altogether

$\endgroup$
0
$\begingroup$

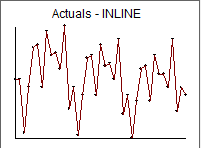
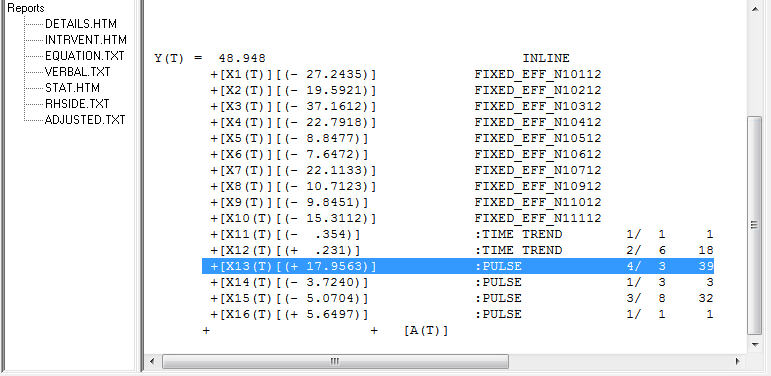
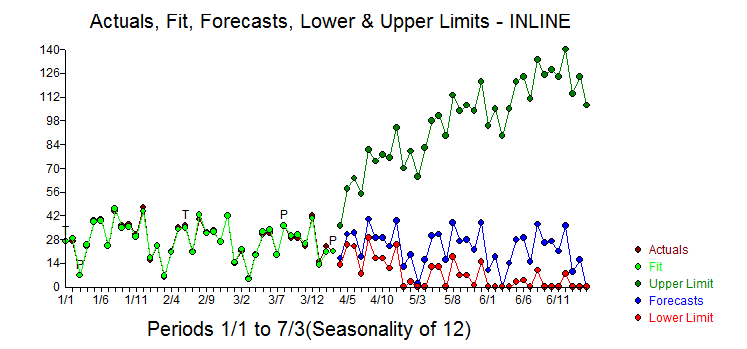
Following up on @forecasters correct comment on outlier detection I took the 39 values enter image description here and found that while the series is non-stationary the remedy is NOT to difference or to de-mean but rather to detrend. A useful model (totally automatic) appears to be a version of the Holt-Winters model ( 11 seasonal dummies ) and two trends (1-17 and 18-39 ) along with a few pulses.enter image description here . Note the very influential value at the last time period 39 (causing our eye and a flawed differencing model ) to over forecast has been adjusted/modified down due to it's clear exceptionally high value . There are a number of very simple ways to deal with a non-stationary series : 1) difference the series ; 2) adjust for level/step shifts ; 3) incorporate time trends . Any approach that doesn't consider all three possibilities can lead to flawed forecasts as in this case. If one "knew" that the observation at period 39 was "real" and not an anomaly the forecast would of course be higher as the user can simply specify this to be "true".

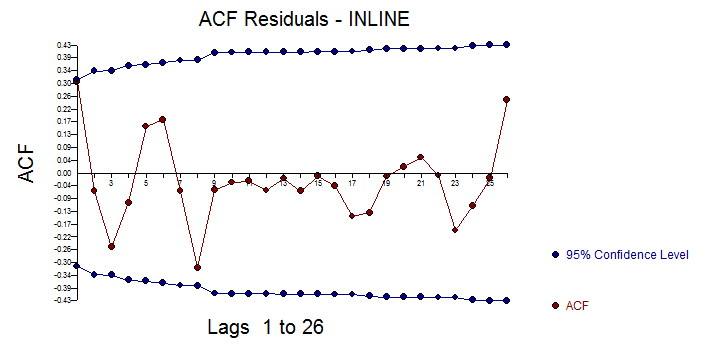
The plot of the residual ACF suggests randomness enter image description here . The Actual/Fit/Forecast graph enter image description here using robust confidence limits calculations that incorporate uncertainties in all the model parameters and the possibility of one-time anomalies arising in the future rather than assuming that they will not happen.

I used AUTOBOX a piece of software that I have helped develop to deal with issues like this. The ARIMA autoprojective scheme although requiring fewer parameters is simply not adequate to deal with this series.

$\endgroup$

Not the answer you're looking for? Browse other questions tagged or ask your own question.