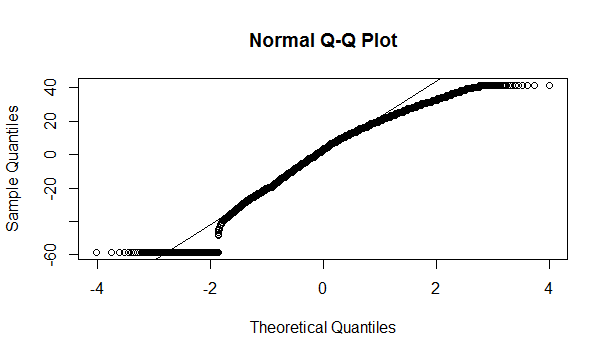
I am trying to do a normality test in order to check whether I can calculate the pearson correlation afterwards. I have read a lot about the three ways to check for normality and generaly found the visual test via qqnorm() and qqline() to be the most useful in my example. My data consists of several variables and each of those variables contains several hundered entries. The variables range between 0 and 100. One thing to note about my data is probably that every variable must contain the value 100 at least once but must not contain the 0 value. This is due to the fact that the data is scaled by its maximum value for the choosen time interval meaning that entry t for variable1 is calculated by the following equation:
Variable1(t) = Value(t) / max(Variable1)
I dont know if that is important but it might cause the data to be skewed to the upside?!
My Question: Am Im allowed to "connect" all the values for each variable by doing something like
x = Modell1[[1]]
for(i in 2:50){ x = c(x,Modelle1[[i]]) }
and than check if the combined data is "normally distributed" and if it is also conclude that each individual variable is thus also normally distributed? All the data comes from the same source and it always displays the relativ search interest for certain queries on Google.
The above picture shows what my data looks like on the qqnorm-plot and I would judge that it is fairly normal distributed, even though I am a little bit confused by the way it is shaped towards the left side. Thanks for any advice.
