0
$\begingroup$

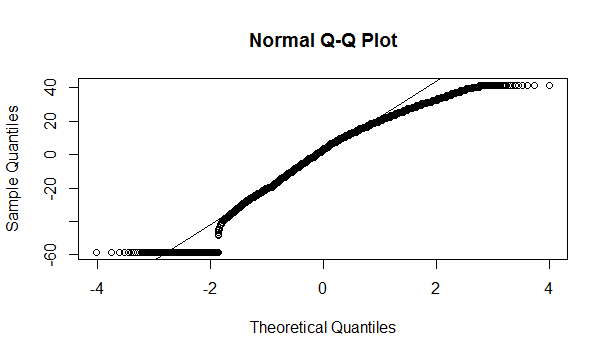
I am trying to model stock returns with the help of google trends data. As explained in my first question this data is normalised by google so that it is not normally distributed as User EdM kindly pointed out. Below I attached a qqnorm()plot for the accumulated values of some of my variables for further insight into their distribution.

enter image description here

Since my data is not normally distributed am I'm still allowed to do an OLS regression and look at performance measures like adjusted R squared and p-values? I saw some posts where it said that those tests are only used for normally distributed data, but that one can still use them due to the central limit theorem. Each variable has approximately 250 data entries in the in-sample data. Is this true? (Sorry, cannot find the posts atm and might be mixing something up)

Additionally, I would be really thankful if you could give me some further insights into model selection. I read a lot about it and as far as I understood it there are no set rules on how to find the best model and that it can get really complex the more variables you have. My problem is that I have more than 100 possible variables and - as far as my knowledge goes - those are simply too many. Hence, I thought I might be able to cut down on the variables by calculating the correlation (spearman) between every independent variable and the dependent variable. I would rank the correlations and start to cut out collinear variables (e.g. variabels that have higher absolute correlation than 0.5 with the variable I am inspecting). I know that I might lose some information by just watching correlation in the first place, but I dont know where else to start. I would do this until I get, lets say, 10 variables with relativ high correlation to the dependent variable and "low" collinearity. Then I would like to use stepwise or best subset regression to find the "best" model and finally use a rolling window approach or cross validation to approve the model.

As you might have guessed I am fairly new to regression statistics or statistics in general. I would be really thankful for any opinion or hint towards the right direction. I did a lot of research over the past few days, but couldnt simply find the right solution for the problems mentioned above.

$\endgroup$

1 Answer 1

1
$\begingroup$

The stock returns that you are trying to model as dependent variables presumably don't have this problem of cutoffs, so you might be able to proceed with a regression approach. (This is different from your earlier question, where you were asking about correlations presumably among your predictor variables.) In a regression the distributions of the predictor variables don't necessarily matter; what matters is the distribution of errors after you have fit your model. You can't know that until you try to build the model. It sounds like you might at least have a case study for starting to learn about the issues you have raised.

The best introductory guide to these issues that I know is An Introduction to Statistical Learning. There you will learn that there are much better approaches to these problems than the ones you have suggested in your question. One hundred variables aren't necessarily too many, provided that you take the appropriate cautions that the authors explain to avoid over-fitting, such as ridge regression with cross-validation (which directly deals with collinearity).

If you are new to regression and statistics then you should be warned that regression on time series, as you seem to intend, poses additional problems. The value of one variable at one time may be correlated with its value at another time, leading to interesting problems even in forecasting individual time series. See this online resource for an introduction. Such issues need to be addressed before you can make much progress on a multivariate time series model (which is beyond my expertise). This Cross Validated page has further references on time series analysis.

I remain worried about a feature of the data that you explained in your earlier question, which is that the data are presented as a percentage of the maximum value seen over a particular time period. Maximum values can be very poorly behaved so that any variable scaling derived from the maxima may also have distributions that pose problems for your analysis, particularly if you use your model in the future where a value of "100" might mean something other than what it meant in building your model. But sometimes you have to work with the data you have instead of the data you might wish for.

$\endgroup$
2
  • $\begingroup$ Thank you for your quick reply once more. I will have a deeper look into the material you linked and see what I can get out of it. So far it looks promissing - really appreciate your help. $\endgroup$
    – Sket
    Commented Sep 8, 2015 at 9:16
  • $\begingroup$ The book you linked was really a great help. I manged to do what I wanted to do and got a far better understanding of what I was working on. Thank you a lot! $\endgroup$
    – Sket
    Commented Sep 15, 2015 at 12:44

Your Answer

By clicking “Post Your Answer”, you agree to our terms of service and acknowledge you have read our privacy policy.

Not the answer you're looking for? Browse other questions tagged or ask your own question.