0
$\begingroup$

I am trying to do a normality test in order to check whether I can calculate the pearson correlation afterwards. I have read a lot about the three ways to check for normality and generaly found the visual test via qqnorm() and qqline() to be the most useful in my example. My data consists of several variables and each of those variables contains several hundered entries. The variables range between 0 and 100. One thing to note about my data is probably that every variable must contain the value 100 at least once but must not contain the 0 value. This is due to the fact that the data is scaled by its maximum value for the choosen time interval meaning that entry t for variable1 is calculated by the following equation:

Variable1(t) = Value(t) / max(Variable1)

I dont know if that is important but it might cause the data to be skewed to the upside?!

My Question: Am Im allowed to "connect" all the values for each variable by doing something like

x = Modell1[[1]]
for(i in 2:50){ x = c(x,Modelle1[[i]]) } 

and than check if the combined data is "normally distributed" and if it is also conclude that each individual variable is thus also normally distributed? All the data comes from the same source and it always displays the relativ search interest for certain queries on Google.enter image description here
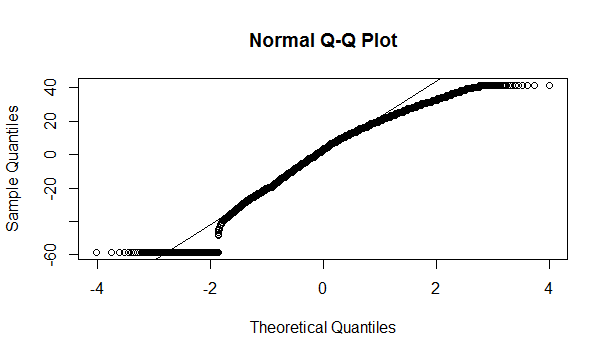
The above picture shows what my data looks like on the qqnorm-plot and I would judge that it is fairly normal distributed, even though I am a little bit confused by the way it is shaped towards the left side. Thanks for any advice.

$\endgroup$

1 Answer 1

1
$\begingroup$

Data that are forced to be positive and are also cut off at the top of the distribution cannot be normal. The flatness of your qq plot at the left represents your positivity constraint, and at the right represents the cutoff at 100 units. These are highly non-normal data. You can do Pearson correlations if you wish, but statistical tests would be meaningless.

If you need to work with data scaled that way you need to do a non-parametric test. Even that may pose problems as there seem to be many ties in the data. Also, the values will be highly dependent on the particular maximum value that happened to show up in your data sample.

You might reconsider your scaling approach and just use the actual values. A correlation coefficient automatically takes different scales of data into account so there's no need for this type of pre-scaling.

A further caution: you seem to be analyzing time series of data. Correlation studies that make sense in other contexts can give misleading results when applied to time series. Taking the time to learn about proper time-series approaches now will save you pain in the future.

$\endgroup$
2
  • 1
    $\begingroup$ Thank you for your thorough explanation! I am using data from google trends which is automatically scaled like this. In your explanation you said that i can do Pearson correlations if I wish, but that statistical test would be meaningless. My aim is to use the correlation as a preselection tool in order to select the best fitting variables for a rolling window ols regression afterwards (do you mean something like that by proper time-series approches?). Should I just use spearman correlation for that? Do you see any problems in that approach? Would be really grateful for some further insights! $\endgroup$
    – Sket
    Commented Sep 5, 2015 at 13:50
  • 1
    $\begingroup$ I guess that releasing poorly scaled data is one way for Google to maintain monopoly power. Selection of individual variables the way you propose is not a good idea however you do the comparisons, as it ignores potentially important relations among predictors. I don't have much practical experience with time series, so I can't comment on rolling window approaches in general, and your regressions will be hampered by the limits on your predictors in any event. A question more directly on what you are trying to accomplish might get a more helpful answer. $\endgroup$
    – EdM
    Commented Sep 5, 2015 at 14:14

Your Answer

By clicking “Post Your Answer”, you agree to our terms of service and acknowledge you have read our privacy policy.

Not the answer you're looking for? Browse other questions tagged or ask your own question.