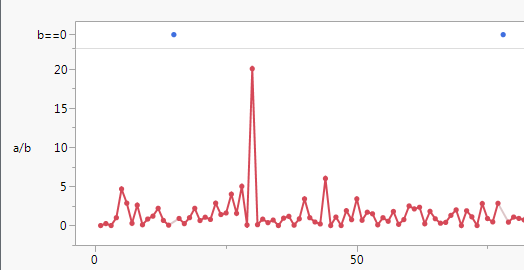
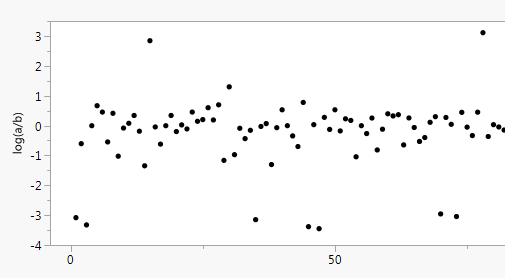
How can I draw a chart for a ratio, not a proportion, when sometimes the ratio is infinity?
Context: I am looking at prescribing of drug A and drug B. I have been drawing bar charts showing prescribing of drug A, per 1000 prescriptions of drug B, over time.
This works great, except when prescriptions of drug B drop to zero. Then I have a problem with my chart, because the proportion is infinity.
How can I visualise the ratio over time, while handling this problem?


