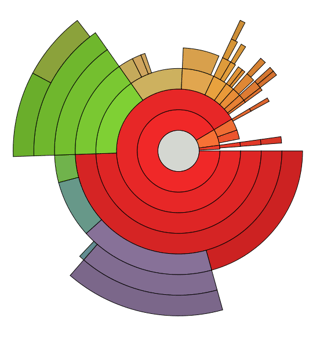
I am trying to understand the details of a multi-level pie chart.
This Wikipedia example gives a picture of a Linux filesystem.
Here are some direct questions, but any further clarification is also welcome.
- The inner gray circle is presumably the root directory '/'?
- The subsequent concentric circle (containing the gray circle) contains three parts - do these represent the size (MB say) of three folders that are contained in the root directory?
- Why does the first four (counting from the centre) parts of the green segment line up radially, whereas other parts do not?
- What could the different colors represent?

