4
$\begingroup$

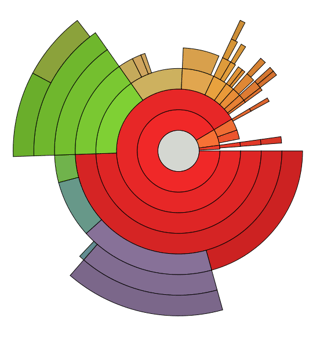
I am trying to understand the details of a multi-level pie chart.

enter image description here

This Wikipedia example gives a picture of a Linux filesystem.

Here are some direct questions, but any further clarification is also welcome.

  1. The inner gray circle is presumably the root directory '/'?
  2. The subsequent concentric circle (containing the gray circle) contains three parts - do these represent the size (MB say) of three folders that are contained in the root directory?
  3. Why does the first four (counting from the centre) parts of the green segment line up radially, whereas other parts do not?
  4. What could the different colors represent?
$\endgroup$
2
  • $\begingroup$ wiki.gnome.org/action/show/Apps/… $\endgroup$ Commented Jul 27, 2018 at 16:14
  • $\begingroup$ @MossMurderer from link: 1. Could be any folder. 2. Yes 3. The first three green sections going outwards radially contain one folder each, and the last one contains two folders. I am guessing that the first three folders contains a folder that is equal to or larger than itself, but the penultimate outside folder which contains two folders, the sum of these two folder sizes are just slightly less than itself (the reason that the outermost green ring does not line up with the previous four)? Or have some files been deleted after the frame of the pie chart has been created? 4. Sub folders $\endgroup$ Commented Jul 27, 2018 at 18:05

1 Answer 1

3
$\begingroup$

The chart is from Disk Usage Analyzer, though the docs don't explain it much. For your questions.

  1. Yes typically, though the user can select any base directory for the chart.
  2. Yes, they represent subparts of the inner "parent" wedge.
  3. The chart is only showing directories, not files. So the gaps represent files that are directly within the next-inner directory.
  4. Colors are only cosmetic. The hue reflects the angle of one of the edges of the wedge in a color wheel, and the darkness reflects the depth of the directory. For details, see the get_item_color function in the source file.
$\endgroup$

Your Answer

By clicking “Post Your Answer”, you agree to our terms of service and acknowledge you have read our privacy policy.

Not the answer you're looking for? Browse other questions tagged or ask your own question.