2
$\begingroup$

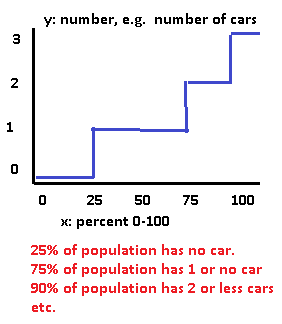
Assume I have a chart below how a certain property is distributed (in this case number of cars over 0-100%) over a population:

  • How is such a chart called? Percentile chart?
  • What are the keywords to search for if I want to know more about such kind of charts?
  • How are such charts typically drawn? Like a 'stair' in the example below?
  • How do I write that the first 90% has 2 or less cars? E.g. "The lowest 90% percentile has 2 or less cars?"

enter image description here

$\endgroup$
3
  • $\begingroup$ I'd call it empirical quantile function $\endgroup$
    – Michael M
    Commented Jul 22, 2016 at 11:50
  • $\begingroup$ Possible duplicate of Graph showing the percentage of observations above each value of a variable $\endgroup$
    – llrs
    Commented Jul 25, 2016 at 7:25
  • $\begingroup$ I wonder if the fact the axes are reversed means this is not an exact duplicate of the other thread. Certainly the answer to this thread would not quite be an answer to the proposed duplicate. $\endgroup$
    – Silverfish
    Commented Jul 25, 2016 at 10:01

2 Answers 2

5
$\begingroup$

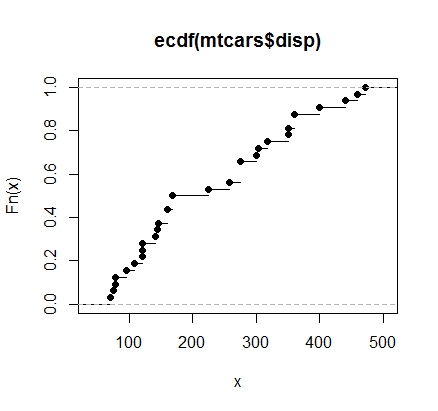
In most cases your plot is presented with flipped axes, where on $x$-axis we present some values and on $y$-axis their cumulated empirical probabilities (see example below). So such plot illustrates empirical cumulative distribution function and I think that in most cases people call it simply empirical cumulative distribution function plot.

enter image description here

Check also here for some examples and definitions Why is the empirical cumulative distribution of 1:1000 a straight line?

$\endgroup$
1
  • $\begingroup$ Helpful, but beware statements on "most"! It depends on which group you are talking about. Plotting the quantiles on the y axis is entirely sound and common in many fields. The full name is also fairly rare in my experience: "empirical" and "function" are very often omitted. $\endgroup$
    – Nick Cox
    Commented Aug 2, 2016 at 11:49
0
$\begingroup$

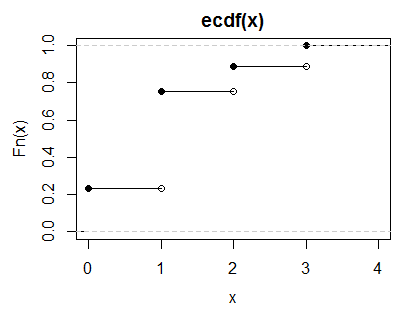
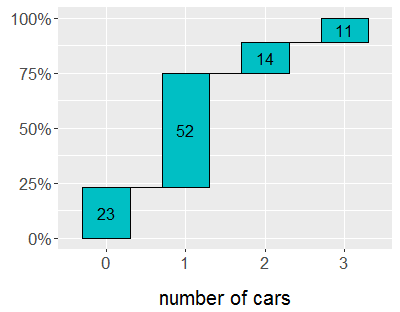
If $X=\lbrace0,1,2,3\rbrace$ and $x\in X$, is typical ecdf plot proper for visualizing the data ? I feel It may be better to specify the intervals closed on the right to avoid misreading. Or may be we should draw the graph like a barplot !??? (I used waterfalls package in R)

enter image description hereenter image description here

$\endgroup$

Your Answer

By clicking “Post Your Answer”, you agree to our terms of service and acknowledge you have read our privacy policy.

Not the answer you're looking for? Browse other questions tagged or ask your own question.