4
$\begingroup$

A book I'm reading (Hogan & Mason, 2012, p37) contains the following passage:

The joint distribution can be factored in two different ways into conditional and marginal probabilities that reveal different aspects of forecast quality. The calibration-refinement factorization is given by
$p\left ( \hat{x},x \right) = p\left (x\mid \hat{x}\right)p\left (\hat{x}\right)$
[...]
The second way of factoring the joint distribution is known as the likelihood-base rate factorization and is given by
$p\left ( \hat{x},x \right) = p\left (\hat{x}\mid x\right)p\left (x\right)$

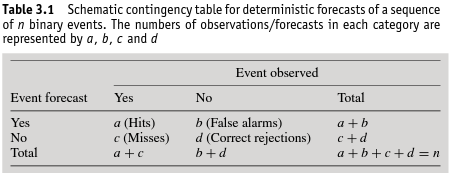
The context for this passage is the discussion of 2 × 2 contingency tables, where the rows represent binary forecasts and the columns represent binary outcomes. On p32 of the same book a schematic table of this sort is provided.

2x2 contingency table

Ideally I'd hope for an answer that doesn't just provide a correct definition, and which also helps to build intuitions about what factorization means and what the point of it is.

Hogan, R. J., & Mason, I. B. (2012). Deterministic forecasts of binary events. Forecast Verification: A Practitioner's Guide in Atmospheric Science, Second Edition, 31-59.

$\endgroup$
7
  • $\begingroup$ As far as I know, it is literally expressing a probability distribution as a product of factors, i.e. $p=p_1p_2\ldots$. More helpfully, it usually refers to something called graphical models. Wikipedia has some OK examples here and here. (The ones with pictures near the top of the articles. The equations are fine too, but a lot more opaque!) $\endgroup$
    – GeoMatt22
    Commented Sep 22, 2016 at 4:01
  • $\begingroup$ If I had to guess it''s saying something about how the joint distribution for two discrete random variables $X$ and $Y$ can be written as $p(x|y)p(y)$ and also $p(y|x)p(x)$. I have no idea what $X$ and $Y$ are, though $\endgroup$
    – Taylor
    Commented Sep 22, 2016 at 4:08
  • $\begingroup$ @GeoMatt Usually it's more than that: the factors need meaningful interpretations as marginal and conditional probabilities or probability densities. $\endgroup$
    – whuber
    Commented Sep 22, 2016 at 4:21
  • $\begingroup$ @whuber yes, I was sloppy. The links I gave explain it better. In areas I run into, the term "factor" would usually not be used for something like Taylor's example, which always holds for any $p(x,y)$. It would normally be associated with conditional independence relationships, I believe? $\endgroup$
    – GeoMatt22
    Commented Sep 22, 2016 at 4:33
  • 1
    $\begingroup$ @GeoMatt Very nicely done! (+1). Your clear and focused exposition, including appropriate links to terms you use, makes for an admirable answer. $\endgroup$
    – whuber
    Commented Sep 22, 2016 at 14:34

1 Answer 1

9
$\begingroup$

If I am understanding the passage and table correctly, there are essentially two answers: mathematical and qualitative.

Qualitatively, the "different aspects of forecast quality" is essentially the idea of false positives vs. false negatives, or precision vs. recall. (I will come back to this.)

Mathematically, the table is comparing two binary variables

$$F =\text{Was an event forecast?}\quad\text{vs.}\quad O =\text{Did an event occur?}$$

and tallying their co-occurences.

The empirical joint distribution of these variables would be $$ \begin{bmatrix} p(\phantom{\sim}F,O) & p(\phantom{\sim}F,\sim\!O) \\ p(\sim\!F,O) & p(\sim\!F,\sim\!O) \\ \end{bmatrix} = \frac{1}{n} \begin{bmatrix} a & b \\ c & d \\ \end{bmatrix} $$ where $$\sim\!F=\text{not }F \quad,\quad \sim\!O=\text{not }O$$ and $n=a+b+c+d$.

The marginal probabilities appear in the margins of the table, and give the total probabilities for forecasts (row sums) \begin{align} p(\phantom{\sim}F) &= p(\phantom{\sim}F,O) + p(\phantom{\sim}F,\sim\!O) = \frac{a+b}{n} \\ p(\sim\!F) &= p(\sim\!F,O) + p(\sim\!F,\sim\!O) = \frac{c+d}{n} \end{align} and observations (column sums) \begin{align} p(\phantom{\sim}O) &= p(F,\phantom{\sim}O) + p(\sim\!F,\phantom{\sim}O) = \frac{a+c}{n} \\ p(\sim\!O) &= p(F,\sim\!O) + p(\sim\!F,\sim\!O) = \frac{b+d}{n} \\ \end{align}

What is not shown in the table are the conditional probabilities. For example what is the probability of an event given that one was forecast? This is given by $$p(O\mid F)=\frac{p(F,O)}{p(F)}=\frac{a}{a+b}$$ (which could be called the precision). The complement of this would be the fraction of false alarms $p(\sim\!O\mid F)$ (or false positives, more generally).

Another perspective would be to condition on $O$. For example the fraction of events that were forecast is given by $$p(F\mid O)=\frac{p(F,O)}{p(O)}=\frac{a}{a+c}$$ (which could be called the recall). The complement of this would be the fraction of false negatives $p(\sim\!F\mid O)$.

Mathematically, these perspectives correspond to two different ways of factoring the joint probability $$p(O\mid F)\,p(F)=p(F,O)=p(F\mid O)\,p(O)$$

(Due to this, a punny personality such as myself might describe the joint probability as the "missing link" in Bayes theorem!)

$\endgroup$
2
  • $\begingroup$ Thanks! Prior to reading your answer I added a few more lines from the original source, since I realised that amount of context I initially provided was perhaps insufficient. $\endgroup$ Commented Sep 22, 2016 at 5:59
  • 1
    $\begingroup$ For intuition I think "forecast" vs. "observed" is better than $\hat{x}$ vs. $x$ (or is it the other way?), so the table is clearer for me :) $\endgroup$
    – GeoMatt22
    Commented Sep 22, 2016 at 6:05

Your Answer

By clicking “Post Your Answer”, you agree to our terms of service and acknowledge you have read our privacy policy.

Not the answer you're looking for? Browse other questions tagged or ask your own question.