3
$\begingroup$

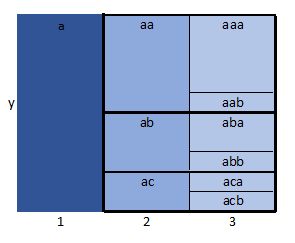
I want to represent hierarchical data of uniform depth as a horizontal tree of tiles in a box. The x-axis would represent hierarchy levels and the y-axis the visualised metric. On the extreme left would be the highest level represented as a single tile occupying the entire height of the box. Next would be a stack of tiles representing the next hierarchical level, with tile height proportional to the share of each tile. Next would be a stack of smaller tiles representing the subdivisions of the previous stack of tiles, etc.

It would be similar to

1) an icicle tree graph, but horizontal and of uniform depth (hence no "icicles" sticking out),

2) a treemap, but non nested and with tiles of uniform width but variable height,

3) a table representation of the hierarchy from left to right, with proportional cell height.

Here's a prototype:

enter image description here

What would you call such a diagram ?

Related question: Is there an R package for this? (I realise the question may not be for this forum.)

(I just realised including level 1 is probably useless, but that doesn't change the general idea.)

$\endgroup$
4
  • $\begingroup$ I've seen this called a "partition layout" or "partition table" in D3.js. $\endgroup$
    – syre
    Commented Oct 2, 2017 at 8:14
  • 1
    $\begingroup$ Old question, but it sounds like you were looking for a Sankey diagram. Here is an example: upload.wikimedia.org/wikipedia/commons/e/e0/… Note that the size of each node is proportional to the quantity it represents. Is it what you were looking for, or does it miss some important features you needed? $\endgroup$
    – J-J-J
    Commented Nov 22, 2023 at 17:58
  • 1
    $\begingroup$ @J-J-J Very cool, thanks! I knew about Sankey diagrams but never made the connection. $\endgroup$
    – syre
    Commented Nov 23, 2023 at 19:40
  • $\begingroup$ you're welcome. I'll turn that into an answer then! $\endgroup$
    – J-J-J
    Commented Nov 23, 2023 at 20:44

1 Answer 1

3
$\begingroup$

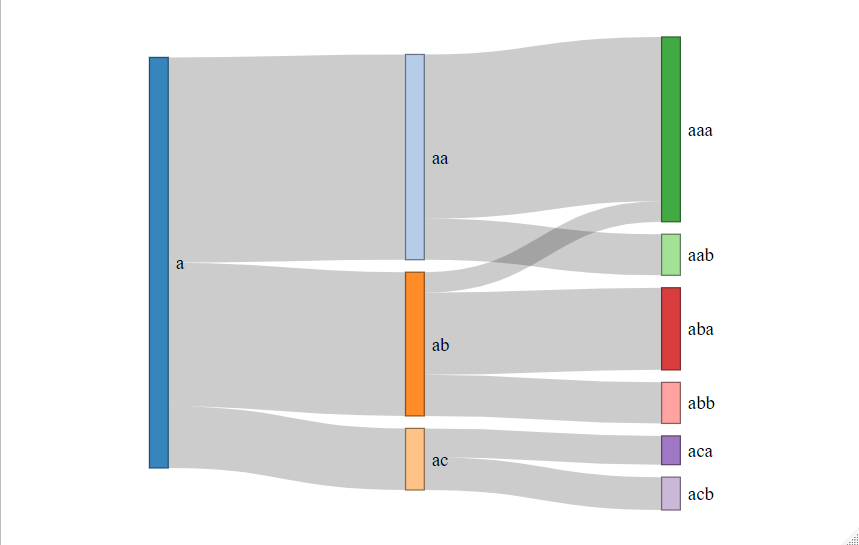
Your prototype was on a good track, as it's partly the idea behind a Sankey diagram (also known as alluvial diagram, or parallel set diagram).

Using some made up data similar to what is shown in your prototype table, it would like this:

A graph showing how the data from the prototype table in the question would look like if visualized with a Sankey diagram: on the left, one big category "A", which branches in three subcategories "aa", "ab", "ac", who themselves have some subcategories. Each node is proportional to the quantity it represents, and we see the relationship between each node.

The nodes do have size proportional to the value they represent.

Compared to your prototype, a strength of Sankey diagrams (besides the fact they are better known) is that they offer more flexibility. For instance if you're in a situation where some nodes share the same "sub-node", a Sankey diagram will allow you to visualize that, while a table couldn't do that:

Same Sankey diagram as before, except that the nodes "aa" and "ab" share a common sub-node

As well, if some nodes do not have subnodes contrary to their "siblings", this can be easily visualized with a Sankey diagram, while it could be confusing with the table format you suggest:

Same graph as the first one, except the node "ab" does not have subnodes, contrary to the nodes "aa" and "ac"

There are several R packages offering this, as it's a relatively famous visualization, available in many software and programming languages. I used network3D to generate the graphs above, but other packages include ggalluvial, alluvial, plotly, and certainly many others.

$\endgroup$
2
  • 1
    $\begingroup$ I guess my diagram belongs to the subset of Sankey diagrams with equally-sized starts and ends and no gaps between branches! $\endgroup$
    – syre
    Commented Dec 28, 2023 at 16:16
  • 1
    $\begingroup$ @syre Yes. I wonder if the gaps are actually useful (or not) for an audience; it could be interesting to conduct a small study on that. Without gaps, it might require to be careful with colors, to avoid possible confusion with a treemap (en.wikipedia.org/wiki/Treemapping ) $\endgroup$
    – J-J-J
    Commented Dec 28, 2023 at 16:34

Your Answer

By clicking “Post Your Answer”, you agree to our terms of service and acknowledge you have read our privacy policy.

Not the answer you're looking for? Browse other questions tagged or ask your own question.