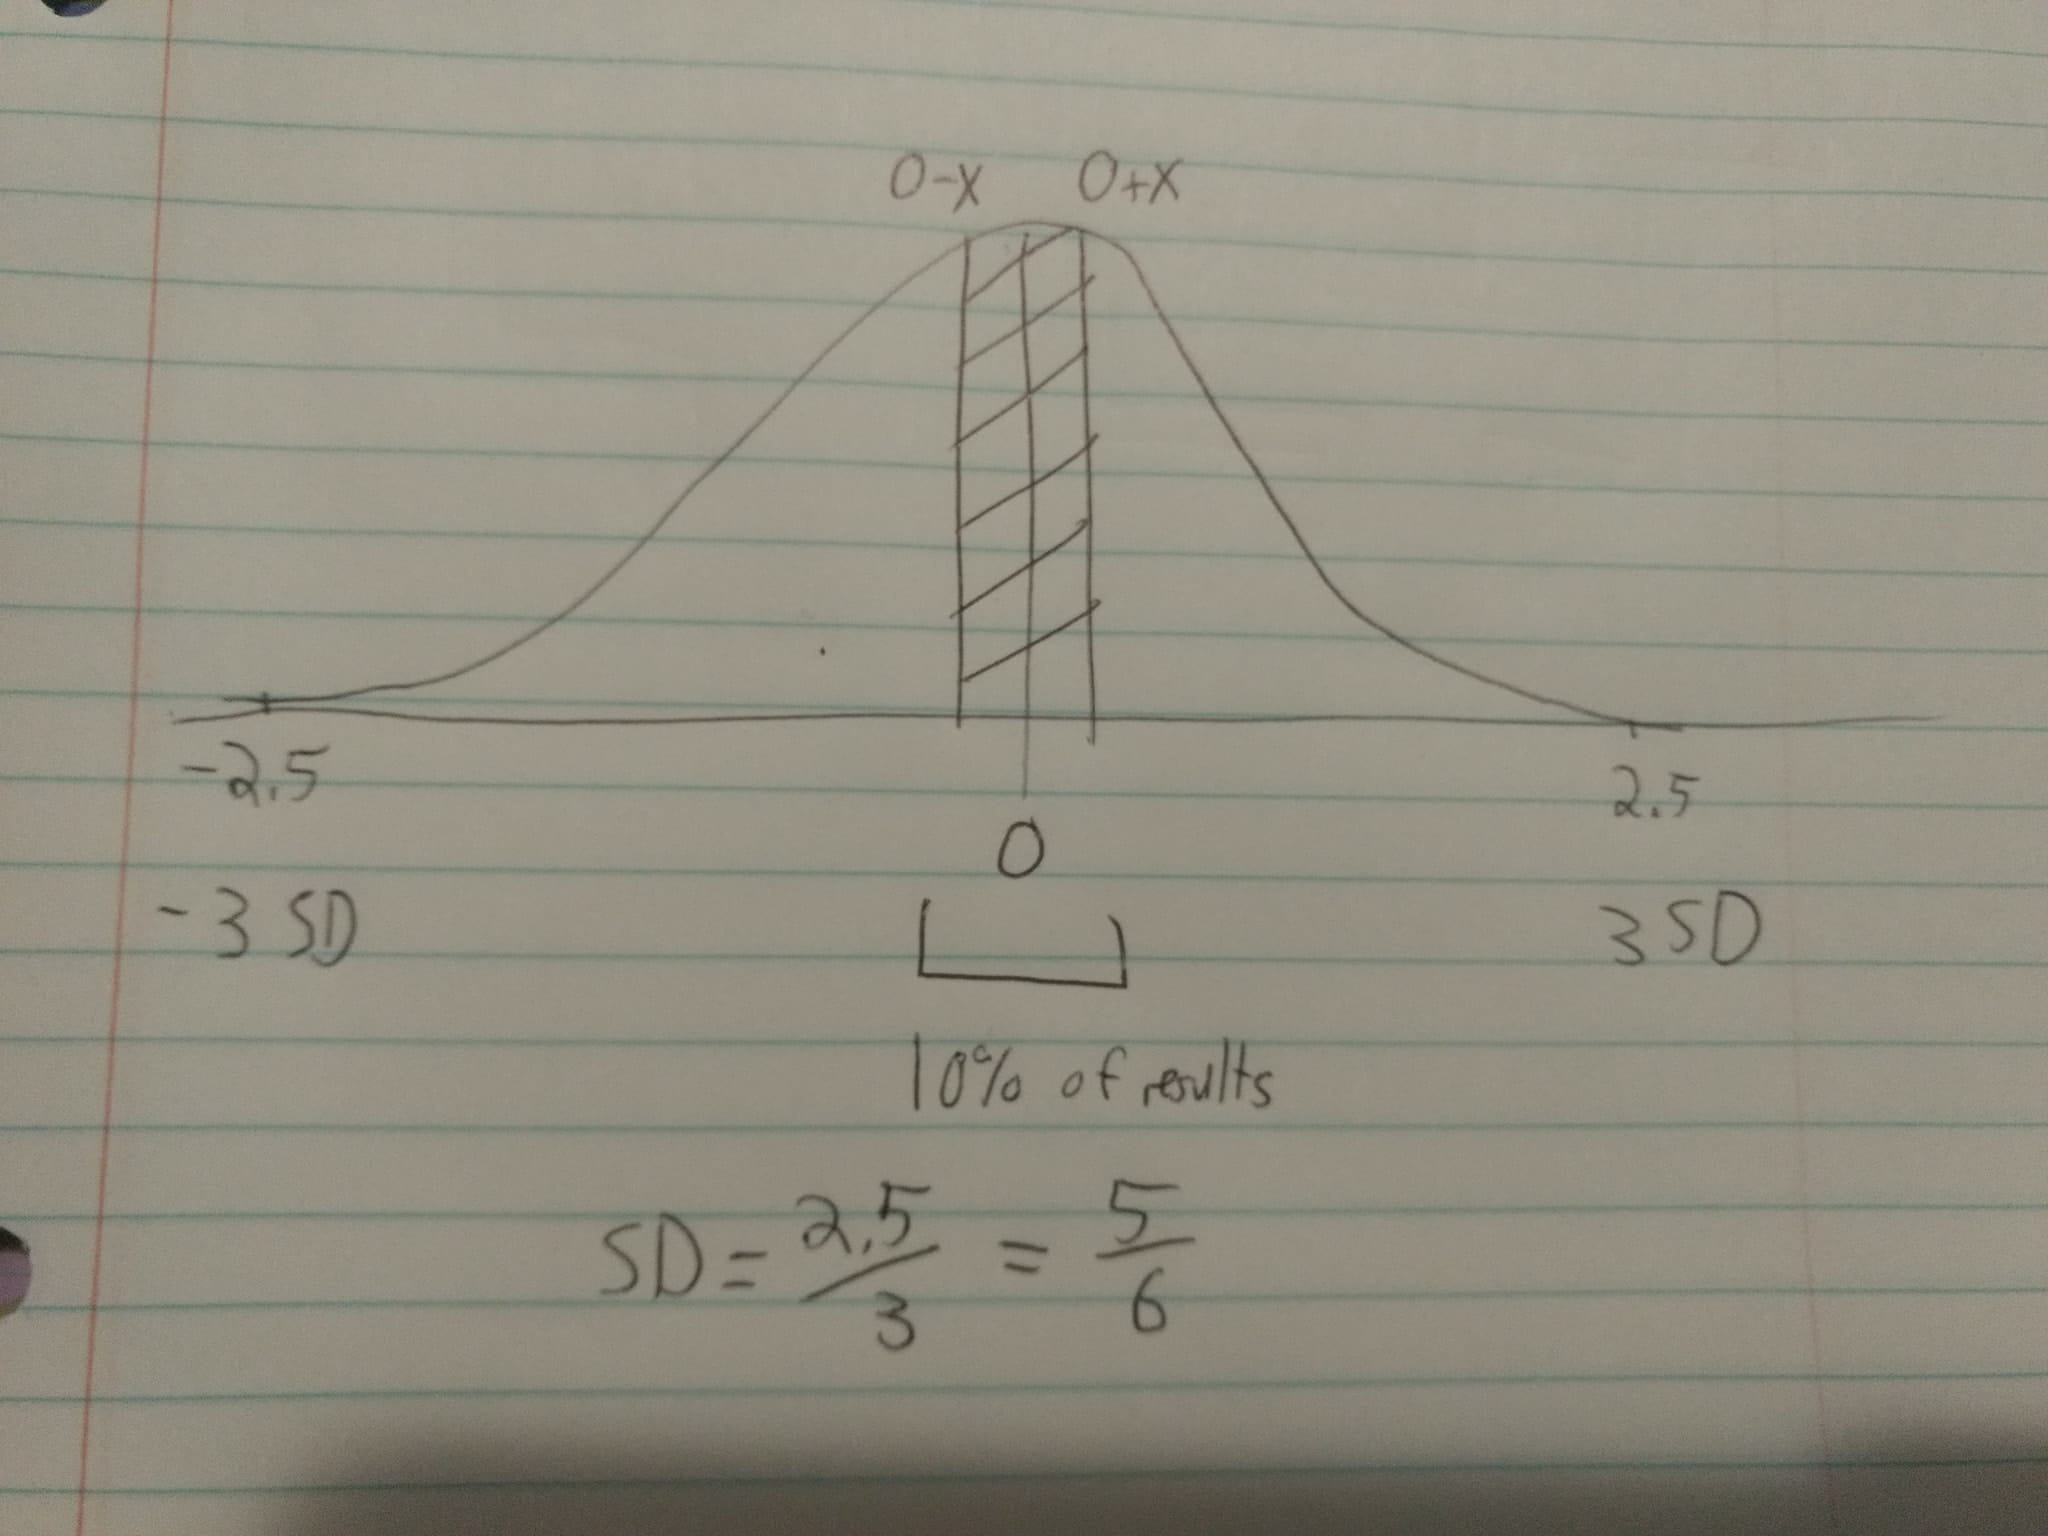
I'm trying to improve a machine learning model. I've modelled a few continuous variables into discrete bins, but I want to make the bins smaller as they approach the mean as to increase sensitivity. For this purpose, I'm making a general purpose function that takes in a value (example: 10%) and returns the positions on a Bell curve under which 10% of the area under the curve lies. The (poorly drawn) picture is likely much clearer than my words. I'm trying to solve for X given a mean, the value that is 3 Standard Deviations away from that mean, and that I want 10% of the area under the curve. I remember taking this in Stats, but I can't remember how to solve it.
1 Answer
If there's probability $0.1$ in $(-x,x)$ then there's $0.9$ outside that interval, and by symmetry, $0.45$ below $-x$; that is:
We have $P(X\leq x) = 0.55\,$, so
\begin{eqnarray} P\left( \frac{X-\mu}{\sigma}\leq \frac{x}{\sigma}\right) &=& 0.55\:,\text{ or }\\ P(Z\leq \frac{_x}{^\sigma}) &=& 0.55\\ \Phi(\frac{_x}{^\sigma}) &=& 0.55\\ \frac{x}{\sigma}&=&\Phi^{-1}(0.55)\\ \end{eqnarray}
so
\begin{eqnarray} x&=&\sigma\,\cdot \Phi^{-1}(0.55)\\ & \approx& 0.12566\, \sigma \end{eqnarray}
(You can get the 0.12566 value from normal tables, or via computer calculation)
More generally if you want a probability $p$ between $-x$ and $x$ then $x = \sigma\,\cdot \Phi^{-1}(\frac{p+1}{2}).$


