I like your question, but unfortunately my answer is NO, it doesn't prove $H_0$. The reason is very simple. How would do you know that the distribution of p-values is uniform? You would probably have to run a test for uniformity which will return you its own p-value, and you end up with the same kind of inference question that you were trying to avoid, only one step farther. Instead of looking at p-value of the original $H_0$, now you look at a p-value of another $H'_0$ about the uniformity of distribution of original p-values.
UPDATE
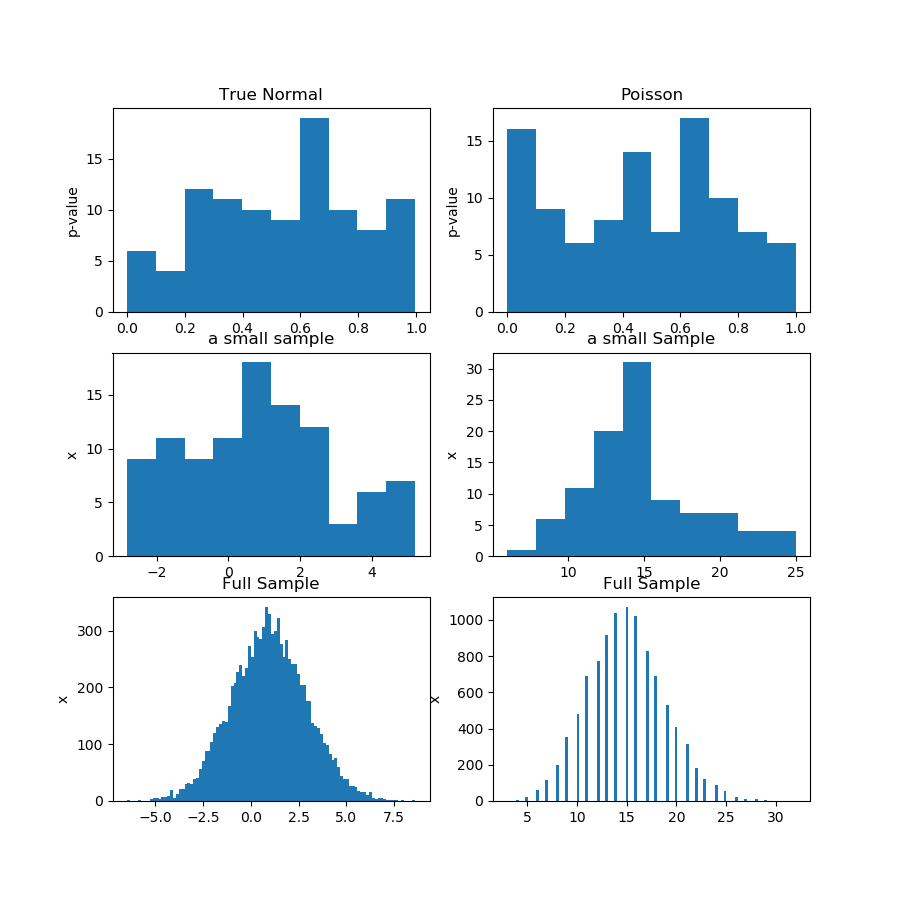
Here's the demonstration. I generate 100 samples of 100 observations from Gaussian and Poisson distribution, then obtain 100 p-values for normality test of each sample. So, the premise of the question is that if the p-values are from uniform distribution, then it proves that the null hypothesis is correct, which is a stronger statement than a usual "fails to reject" in statistical inference. The trouble is that "the p-values are from uniform" is a hypothesis itself, which you have to somehow test.
In the picture (first row) below I'm showing the histograms of p-values from a normality test for the Guassian and Poisson sample, and you can see that it's hard to say whether one is more uniform than the other. That was my main point.
The second row shows one of the samples from each distribution. The samples are relatively small, so you can't have too many bins indeed. Actually, this particular Gaussian sample doesn't look that much Gaussian at all on the histogram.
In the third row, I'm showing the combined samples of 10,000 observations for each distribution on a histogram. Here, you can have more bins, and the shapes are more obvious.
Finally, I run the same normality test and get p-values for the combined samples and it rejects normality for Poisson, while failing to reject for Gaussian. The p-values are: [0.45348631] [0.]

This is not a proof, of course, but the demonstration of the idea that you better run the same test on the combined sample, instead of trying to analyze the distribution of p-values from subsamples.
Here's Python code:
import numpy as np
from scipy import stats
from matplotlib import pyplot as plt

def pvs(x):
    pn = x.shape[1]
    pvals = np.zeros(pn)
    for i in range(pn):
        pvals[i] = stats.jarque_bera(x[:,i])[1]
    return pvals

n = 100
pn = 100
mu, sigma = 1, 2
np.random.seed(0)
x = np.random.normal(mu, sigma, size=(n,pn))
x2 = np.random.poisson(15, size=(n,pn))
print(x[1,1])

pvals = pvs(x)
pvals2 = pvs(x2)

x_f = x.reshape((n*pn,1))
pvals_f = pvs(x_f)

x2_f = x2.reshape((n*pn,1))
pvals2_f = pvs(x2_f)
print(pvals_f,pvals2_f)

print(x_f.shape,x_f[:,0])


#print(pvals)
plt.figure(figsize=(9,9))
plt.subplot(3,2,1)
plt.hist(pvals)
plt.gca().set_title('True Normal')
plt.gca().set_ylabel('p-value')

plt.subplot(3,2,2)
plt.hist(pvals2)
plt.gca().set_title('Poisson')
plt.gca().set_ylabel('p-value')

plt.subplot(3,2,3)
plt.hist(x[:,0])
plt.gca().set_title('a small sample')
plt.gca().set_ylabel('x')

plt.subplot(3,2,4)
plt.hist(x2[:,0])
plt.gca().set_title('a small Sample')
plt.gca().set_ylabel('x')

plt.subplot(3,2,5)
plt.hist(x_f[:,0],100)
plt.gca().set_title('Full Sample')
plt.gca().set_ylabel('x')

plt.subplot(3,2,6)
plt.hist(x2_f[:,0],100)
plt.gca().set_title('Full Sample')
plt.gca().set_ylabel('x')

plt.show()

