2
$\begingroup$

I have been running the Wilcoxon signed rank test, where my output is a p-value. Now, the p-value interpretation I am confident in, but I read in a paper that the authors reported the:

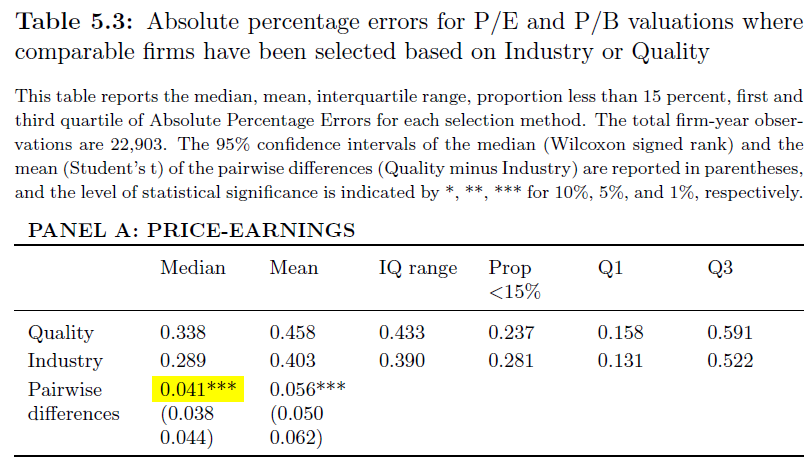
The Wilcoxon test estimates the median of the pairwise differences at 4.1 percentage points (with the 95% confidence interval being 3.8 and 4.4 pp.)

I would also like to produce a statistic like this, but how would I get it usually? The authors output looks like this:

enter image description here

where I have highlighted the 4.1 percentage points with yellow. My issue is that I don't know how to obtain this number, since all I am getting is a p-value?

$\endgroup$

2 Answers 2

1
$\begingroup$

Your data looks something like this

t1    t2
12    8
7     10
...   ...

So you have two variables with the two values for each object. What you need to do in case you want to use a dependent Wilcoxon test is to calculate the difference between the pairs and save the values in a new variable:

t1    t2    difference
12    8     4
7     10    -3
...   ...   ...

All you need to do is to calculate the median of the new variable difference. This gives you the value you are looking for. Also see here.

In R this would be

set.seed(1) # making it a reproducible example
n <- 100 # number of observations
t1 <- rnorm(n) # first measurement
t2 <- rnorm(n) # second measurement
difference <- t1 - t2 # difference between measurements
median(difference) # median of the difference
0.1955015 # this is the value you are looking for

If you need to run an independent Wilcoxon test, get the both medians of t1 and t2 first and then calculate the difference in the median. That would be:

# Difference in median between two groups
median(t1) - median(t2)

EDIT

@LuckyPal: As LuckyPal says the Wilcoxon test does not test the medians. This is most obvious if the median is near to zero but the Wilcoxon test is still significant (see here). Anyway, in my area it is nonetheless usual that people report the median to give some impression what the W statistic and the p value mean (how big is the change in the scale of the two variables?). This is why I tried to provide the answer the questioner was seemingly looking for.

$\endgroup$
10
  • $\begingroup$ valid point and good suggestion (+1) $\endgroup$
    – LuckyPal
    Commented Apr 23, 2019 at 14:18
  • 1
    $\begingroup$ Hi, thank you for the suggestion! But I am not sure, that the Median value I calculate is correct, compared to the snippet of the article. The point is to show, that the mean and median values of 1 system (Industry) are all lower than the mean and median produces from (Quality). Given that Industry has a lower absolute percentage error, it should be no surprise that the Pairwise Difference 4.1 percentage points is present. In other words, Industry is 4.1 percentage points better. THe story is the same for my data; however, when I use your method, I get a negative median... $\endgroup$
    – Philip
    Commented Apr 23, 2019 at 14:35
  • $\begingroup$ @Philip:I think all you need to do is to switching the variables. So use difference= quality - industry instead of difference= industry - quality. $\endgroup$
    – user244721
    Commented Apr 23, 2019 at 14:48
  • 1
    $\begingroup$ Aaah, of course. I got a bit confused with the notion that "the higher the better", which is not the case for this test. Thank you. But assuming I get a median difference of 1%, how will I translate that into a significance level? Will I simply run the Wilcoxon test for 1%, 5% and 10% and conclude by the calculated median of the differences, that it is indeed significant? $\endgroup$
    – Philip
    Commented Apr 23, 2019 at 15:02
  • $\begingroup$ @Philip: I thought the p value is what you had from the beginning. At least your question says so. Another question: do you actually need to perform a dependent or a independent wilcoxon test? I was refering to a depending wilcoxon test because the picture you show says "pairwise differences". $\endgroup$
    – user244721
    Commented Apr 23, 2019 at 15:08
0
$\begingroup$

It is interesting that it is so widely spread that Wilcoxon tests the difference between medians. This is only true, if following assumptions are met:

  1. The distribution of both groups must have the same shape.
  2. The variance of both groups must be equal.

Which was formulated by CV user Alexis. For some more information: Wilcoxon signed-rank test null hypothesis statement

If these assumptions cannot be made, then the Wilcoxon test is only a test for equality of the central tendencies of the two samples. Unfortunately, this a rather abstract measure.

Regarding the statement from the paper that you cite: the Wilcoxon test does not estimate medians. Even further: the data that the Wilcoxon test uses does not even contain information about the median! For the test, all values are transferred into ranks, so there is no information about the median value anymore.

Therefore, you have to take another approach. The median you can easily determine yourself when you simply produce the summary statistics for the numerical difference in your preferred statistical software program. The confidence interval is a more tricky one. Since you used a non-parametric approach in the first point, you are probably not willing to make any assumptions regarding the distribution of the data. So I would suggest to use Bootstrap. How to implement this, depends on your software, but all current statistical software programs should have an implementation to do that.

$\endgroup$
1
  • 1
    $\begingroup$ I completely agree about the limited inference of the Wilcoxon, this is why I have already produced two empirical distribution plots, which are very identical (i.e. same shape). Testing whether or not the variance is equal, I guess can be done from a t-test? $\endgroup$
    – Philip
    Commented Apr 23, 2019 at 16:12

Your Answer

By clicking “Post Your Answer”, you agree to our terms of service and acknowledge you have read our privacy policy.

Not the answer you're looking for? Browse other questions tagged or ask your own question.