0
$\begingroup$

enter image description here

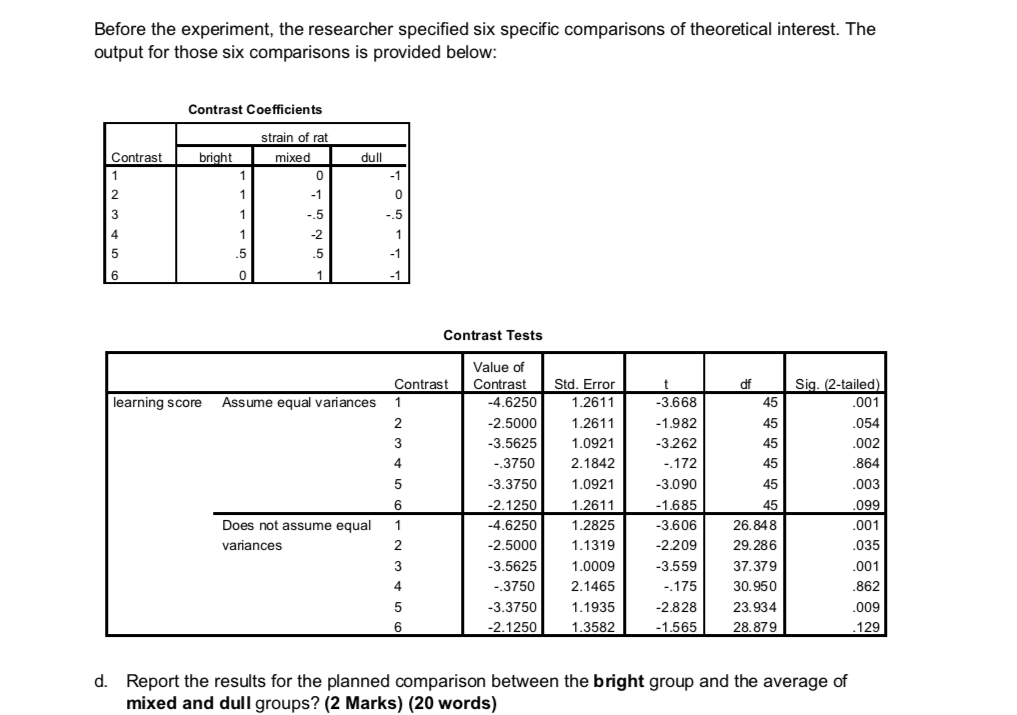
Looking at Levene's test of homogeneity of variance that was statistically significant (related to the question but i have not added it as an image). Hence, i would need to look at the "does not assume equal variance data in the table.

Hence, I would answer the question by looking at the sig fig or by subtracting the value of contrast from std error. Since, i know how to answer this question when there's only one type of data present. But i'm not sure, if i would look at the sig figs and assume whether they're statistically signficant in the "does not assume equal variance table" and create a hypothesis between the two groups?.

$\endgroup$

1 Answer 1

0
$\begingroup$

This looks like a homework problem. I assume the course is over now. The contrast asked about is #3, with coefficients 1 for the bright group and -.5 for each of the other two groups. The difference between the mean for the bright group and the average of the other two is in the Value of Contrast column. The p value or significance associated with it is .001 using separate variance estimates.

$\endgroup$

Your Answer

By clicking “Post Your Answer”, you agree to our terms of service and acknowledge you have read our privacy policy.

Not the answer you're looking for? Browse other questions tagged or ask your own question.