I have the following data:
structure(list(V1 = c(0.94651, 0.5383, 0.96285, 0.91922, 0.46489,
0.77343, 0.90285, 1.0069, 0.4285, -0.016644, 0.73531, -0.010766,
0.72106, 0.71081, -0.086889, 0.37988, 0.32897, 0.52904, -0.0084557,
0.10109), V2 = c(-0.56207, -0.31966, -0.57178, -0.54587, -0.27607,
-0.45929, -0.53615, -0.59794, -0.25446, 0.0098841, -0.43665,
0.006393, -0.42819, -0.4221, 0.051598, -0.22559, -0.19535, -0.31416,
0.0050213, -0.060033), V3 = c(0.8266, 0.085098, 0.81386, 0.94114,
-0.094576, 0.15722, 0.41302, 0.54406, -0.070067, -0.37905, 0.72315,
0.037326, 0.72163, 0.84899, 0.024539, 0.073047, 0.12855, 0.19081,
0.037335, -0.025786), V4 = c(0.085098, 0.77217, 0.087477, 0.095301,
-0.11338, 0.029254, 0.055516, 0.013586, -0.07974, -0.058024,
0.042291, 0.23548, 0.067229, 0.057507, 0.035961, 0.11495, 0.069248,
0.03216, -0.064853, 0.044449), V5 = c(0.81386, 0.087477, 0.80893,
0.92834, -0.042251, 0.23575, 0.46973, 0.58175, -0.012993, -0.30251,
0.73196, 0.053843, 0.74423, 0.85489, 0.044913, 0.13302, 0.16572,
0.22198, 0.076549, 0.017349), V6 = c(0.94114, 0.095301, 0.92834,
1.0931, -0.082746, 0.18189, 0.4852, 0.62751, -0.085199, -0.4134,
0.8921, 0.047127, 0.89089, 1.0642, 0.042064, 0.080492, 0.14708,
0.21112, 0.042478, -0.028438), V7 = c(-0.094576, -0.11338, -0.042251,
-0.082746, 0.80368, 0.6199, 0.53577, 0.43571, 0.52259, 0.72283,
0.14265, 0.12527, 0.15794, 0.10972, 0.27052, 0.35122, 0.24159,
0.1599, 0.28239, 0.32291), V8 = c(0.15722, 0.029254, 0.23575,
0.18189, 0.6199, 1.045, 0.81547, 0.65866, 0.71941, 0.82931, 0.32166,
0.1449, 0.43432, 0.30115, 0.19978, 0.78488, 0.46836, 0.40675,
0.49992, 0.5234), V9 = c(0.41302, 0.055516, 0.46973, 0.4852,
0.53577, 0.81547, 0.88555, 0.7562, 0.51057, 0.47113, 0.54481,
0.15711, 0.61531, 0.59215, 0.26507, 0.59573, 0.48186, 0.39617,
0.38826, 0.37683), V10 = c(0.54406, 0.013586, 0.58175, 0.62751,
0.43571, 0.65866, 0.7562, 0.78475, 0.39652, 0.27494, 0.61592,
0.1222, 0.66145, 0.66101, 0.16319, 0.40111, 0.31974, 0.34904,
0.28275, 0.25133), V11 = c(-0.070067, -0.07974, -0.012993, -0.085199,
0.52259, 0.71941, 0.51057, 0.39652, 1.0164, 0.69192, 0.12521,
0.15234, 0.18136, 0.066519, 0.074701, 0.50289, 0.29894, 0.25127,
0.67174, 0.3459), V12 = c(-0.37905, -0.058024, -0.30251, -0.4134,
0.72283, 0.82931, 0.47113, 0.27494, 0.69192, 1.1506, -0.1139,
0.14507, -0.027262, -0.2119, 0.16865, 0.60408, 0.30354, 0.21503,
0.40543, 0.55259), V13 = c(0.72315, 0.042291, 0.73196, 0.8921,
0.14265, 0.32166, 0.54481, 0.61592, 0.12521, -0.1139, 1.5481,
0.2868, 1.5331, 1.604, 0.32047, 0.29921, 0.30592, 0.49005, 0.391,
0.17689), V14 = c(0.037326, 0.23548, 0.053843, 0.047127, 0.12527,
0.1449, 0.15711, 0.1222, 0.15234, 0.14507, 0.2868, 0.76717, 0.36333,
0.21414, 0.33952, 0.35815, 0.24875, 0.35865, 0.4172, 0.28988),
    V15 = c(0.72163, 0.067229, 0.74423, 0.89089, 0.15794, 0.43432,
    0.61531, 0.66145, 0.18136, -0.027262, 1.5331, 0.36333, 1.6139,
    1.5989, 0.3219, 0.41679, 0.37344, 0.59587, 0.493, 0.24522
    ), V16 = c(0.84899, 0.057507, 0.85489, 1.0642, 0.10972, 0.30115,
    0.59215, 0.66101, 0.066519, -0.2119, 1.604, 0.21414, 1.5989,
    1.8191, 0.2722, 0.25619, 0.28694, 0.40081, 0.29757, 0.12688
    ), V17 = c(0.024539, 0.035961, 0.044913, 0.042064, 0.27052,
    0.19978, 0.26507, 0.16319, 0.074701, 0.16865, 0.32047, 0.33952,
    0.3219, 0.2722, 0.92673, 0.42773, 0.41275, 0.47912, 0.37034,
    0.35505), V18 = c(0.073047, 0.11495, 0.13302, 0.080492, 0.35122,
    0.78488, 0.59573, 0.40111, 0.50289, 0.60408, 0.29921, 0.35815,
    0.41679, 0.25619, 0.42773, 1.0542, 0.61743, 0.57759, 0.67009,
    0.67155), V19 = c(0.12855, 0.069248, 0.16572, 0.14708, 0.24159,
    0.46836, 0.48186, 0.31974, 0.29894, 0.30354, 0.30592, 0.24875,
    0.37344, 0.28694, 0.41275, 0.61743, 0.51219, 0.46494, 0.47372,
    0.39662), V20 = c(0.19081, 0.03216, 0.22198, 0.21112, 0.1599,
    0.40675, 0.39617, 0.34904, 0.25127, 0.21503, 0.49005, 0.35865,
    0.59587, 0.40081, 0.47912, 0.57759, 0.46494, 0.79956, 0.50647,
    0.40812), V21 = c(0.037335, -0.064853, 0.076549, 0.042478,
    0.28239, 0.49992, 0.38826, 0.28275, 0.67174, 0.40543, 0.391,
    0.4172, 0.493, 0.29757, 0.37034, 0.67009, 0.47372, 0.50647,
    1.4825, 0.40309), V22 = c(-0.025786, 0.044449, 0.017349,
    -0.028438, 0.32291, 0.5234, 0.37683, 0.25133, 0.3459, 0.55259,
    0.17689, 0.28988, 0.24522, 0.12688, 0.35505, 0.67155, 0.39662,
    0.40812, 0.40309, 0.59524), V23 = c(0.25527, -0.017435, 0.24472,
    0.19172, -0.08942, 0.019515, 0.023886, 0.085312, -0.1077,
    -0.25759, -0.0056936, -0.16772, 0.00016361, 0.032313, -0.29165,
    -0.055895, -0.061876, 0.011813, -0.18098, -0.14357), V24 = c(-0.017435,
    0.86281, -0.01802, -0.013843, -0.20764, -0.034841, -0.011684,
    -0.054282, -0.05775, -0.079061, 0.039397, 0.48237, 0.04116,
    0.017332, 0.033632, 0.044072, 0.019504, -0.027936, 0.057321,
    0.0088914), V25 = c(0.24472, -0.01802, 0.23612, 0.18369,
    -0.069095, 0.042049, 0.039087, 0.092742, -0.091879, -0.22268,
    -0.0020998, -0.1605, 0.0058407, 0.032342, -0.27061, -0.025945,
    -0.034951, 0.03467, -0.16788, -0.11148), V26 = c(0.19172,
    -0.013843, 0.18369, 0.14561, -0.074105, 0.012767, 0.019197,
    0.063111, -0.08197, -0.19216, -0.0014697, -0.12429, 0.0022122,
    0.025654, -0.21522, -0.039968, -0.042864, 0.0073339, -0.13347,
    -0.10308), V27 = c(-0.08942, -0.20764, -0.069095, -0.074105,
    0.91404, 0.34296, 0.1169, 0.18089, 0.39112, 0.51196, 0.071998,
    0.039649, 0.060645, 0.014709, 0.40831, 0.13309, 0.10797,
    0.27916, 0.1567, 0.2165), V28 = c(0.019515, -0.034841, 0.042049,
    0.012767, 0.34296, 0.40838, 0.26292, 0.19653, 0.22056, 0.42274,
    0.063293, -0.0042594, 0.089042, 0.026711, 0.16124, 0.43457,
    0.39117, 0.39529, 0.076837, 0.425), V29 = c(0.023886, -0.011684,
    0.039087, 0.019197, 0.1169, 0.26292, 0.29695, 0.15903, 0.129,
    0.27237, 0.055221, 0.037713, 0.071066, 0.02503, 0.074612,
    0.39081, 0.53542, 0.40199, 0.061141, 0.40689), V30 = c(0.085312,
    -0.054282, 0.092742, 0.063111, 0.18089, 0.19653, 0.15903,
    0.16809, 0.093384, 0.11927, 0.04596, -0.027867, 0.052697,
    0.030282, 0.030441, 0.18169, 0.19679, 0.26977, -0.0073689,
    0.1654), V31 = c(-0.1077, -0.05775, -0.091879, -0.08197,
    0.39112, 0.22056, 0.129, 0.093384, 0.81882, 0.36239, 0.11077,
    0.11839, 0.10007, 0.028829, 0.28994, 0.2202, 0.23569, 0.26342,
    0.3219, 0.28324), V32 = c(-0.25759, -0.079061, -0.22268,
    -0.19216, 0.51196, 0.42274, 0.27237, 0.11927, 0.36239, 0.9133,
    0.079302, 0.17579, 0.091098, -0.0070463, 0.54, 0.54119, 0.53789,
    0.4253, 0.31003, 0.772), V33 = c(-0.0056936, 0.039397, -0.0020998,
    -0.0014697, 0.071998, 0.063293, 0.055221, 0.04596, 0.11077,
    0.079302, 0.16478, 0.17777, 0.14017, 0.071905, 0.13318, 0.12564,
    0.11937, 0.15937, 0.15798, 0.18798), V34 = c(-0.16772, 0.48237,
    -0.1605, -0.12429, 0.039649, -0.0042594, 0.037713, -0.027867,
    0.11839, 0.17579, 0.17777, 1.1407, 0.1481, 0.058347, 0.43169,
    0.16129, 0.16705, 0.16025, 0.40938, 0.27552), V35 = c(0.00016361,
    0.04116, 0.0058407, 0.0022122, 0.060645, 0.089042, 0.071066,
    0.052697, 0.10007, 0.091098, 0.14017, 0.1481, 0.14548, 0.061918,
    0.10971, 0.15723, 0.13187, 0.17229, 0.13877, 0.175), V36 = c(0.032313,
    0.017332, 0.032342, 0.025654, 0.014709, 0.026711, 0.02503,
    0.030282, 0.028829, -0.0070463, 0.071905, 0.058347, 0.061918,
    0.037792, 0.017188, 0.046331, 0.040203, 0.06882, 0.04331,
    0.05934), V37 = c(-0.29165, 0.033632, -0.27061, -0.21522,
    0.40831, 0.16124, 0.074612, 0.030441, 0.28994, 0.54, 0.13318,
    0.43169, 0.10971, 0.017188, 1.0391, 0.31502, 0.21118, 0.28367,
    0.43956, 0.47978), V38 = c(-0.055895, 0.044072, -0.025945,
    -0.039968, 0.13309, 0.43457, 0.39081, 0.18169, 0.2202, 0.54119,
    0.12564, 0.16129, 0.15723, 0.046331, 0.31502, 0.83371, 0.79387,
    0.6541, 0.23566, 0.84715), V39 = c(-0.061876, 0.019504, -0.034951,
    -0.042864, 0.10797, 0.39117, 0.53542, 0.19679, 0.23569, 0.53789,
    0.11937, 0.16705, 0.13187, 0.040203, 0.21118, 0.79387, 1.1892,
    0.79066, 0.21556, 0.89389), V40 = c(0.011813, -0.027936,
    0.03467, 0.0073339, 0.27916, 0.39529, 0.40199, 0.26977, 0.26342,
    0.4253, 0.15937, 0.16025, 0.17229, 0.06882, 0.28367, 0.6541,
    0.79066, 0.85596, 0.20311, 0.68227), V41 = c(-0.18098, 0.057321,
    -0.16788, -0.13347, 0.1567, 0.076837, 0.061141, -0.0073689,
    0.3219, 0.31003, 0.15798, 0.40938, 0.13877, 0.04331, 0.43956,
    0.23566, 0.21556, 0.20311, 0.71678, 0.35077), V42 = c(-0.14357,
    0.0088914, -0.11148, -0.10308, 0.2165, 0.425, 0.40689, 0.1654,
    0.28324, 0.772, 0.18798, 0.27552, 0.175, 0.05934, 0.47978,
    0.84715, 0.89389, 0.68227, 0.35077, 1.233)), class = "data.frame", row.names = c(NA,
-20L))
My code is as follows:
data <- read.csv("data.csv", header = FALSE)
eigen_fun <- function() {
  sigma1 <- as.matrix((data[,3:22]))
  sigma2 <- as.matrix((data[,23:42]))
  sample1 <- mvrnorm(n = 250, mu = as_vector(data[,1]), Sigma = sigma1)
  sample2 <- mvrnorm(n = 250, mu = as_vector(data[,2]), Sigma = sigma2)
  sampCombined <- rbind(sample1, sample2);
  covCombined <- cov(sampCombined);
  covCombinedPCA <- prcomp(sampCombined);
  eigenvalues <- covCombinedPCA$sdev^2;
}
mat <- replicate(50, eigen_fun())
colMeans(mat)
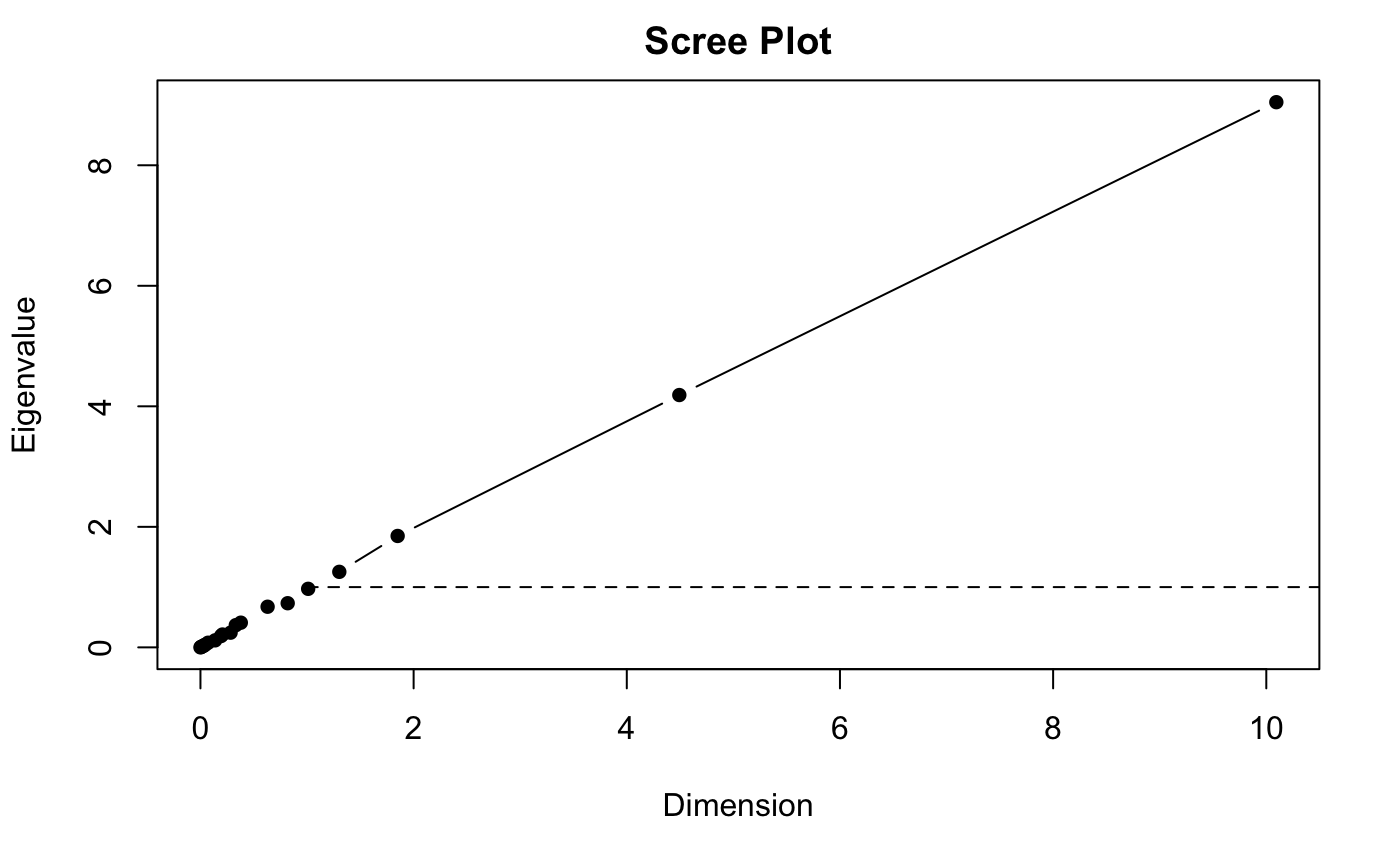
scree.plot(mat, title = "Scree Plot", type = "E", use = "complete.obs", simu = "F");
I start by generating 250 random samples from the normal distribution $N (\mu_1, \Sigma_1)$ and 250 samples from the normal distribution $N (\mu_2, \Sigma_2)$. I then calculate the sample covariance matrix of these 500 random samples, and then find eigenvalues of the sample covariance matrix.
I then repeat this part so that I have a total of 50 vectors of eigenvalues mat.
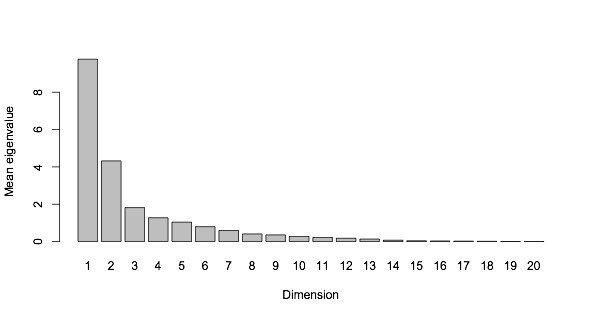
I then calculate the mean vector of eigenvalues over the 50 repetitions using colMeans(mat).
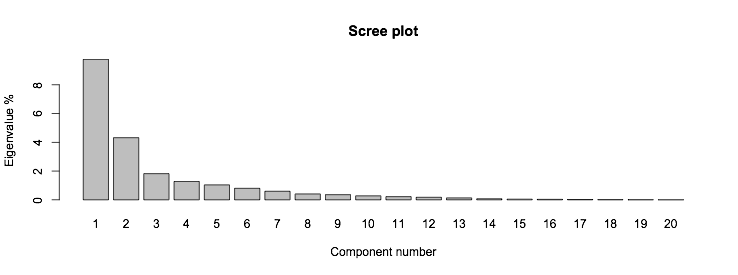
Lastly, I want to display the 50 vectors of eigenvalues and their mean vector in an eigenvalue or scree plot. Despite being a novice, looking at this plot, it seems to me that something is wrong? Have I done something incorrectly?
EDIT:
There's also screeplots() https://www.rdocumentation.org/packages/stats/versions/3.6.2/topics/screeplot , but I don't know how to make this one work with the 50 vectors of eigenvalues.


